
USD/CHF holds its ground after soft Swiss CPI
- The USD/CHF extended its decline despite soft CPI figures from Switzerland.
- US ADP employment report and ISM Services PMI data for June from the US came in weaker than expected which pressures down the pair.
- Due to softening inflation, the SNB might embrace further cuts.
In Thursday's session, the USD/CHF pair slightly declined, with markets showing a less enthusiastic attitude towards the USD after weak data outcomes. The key movers are the disappointing US ISM Services PMI for June, which indicated a contraction in the US service sector reported on Wednesday. In the European session, the Swiss inflation figures came in soft.
The center of attention on Wednesday was the weak ADP Employment report for June, with private sector jobs increasing by 150K compared to the revised forecast of 160K. Additionally, the ISM Services PMI considerably underperformed, dropping to 48.8 from 53.8 in May and missing the market expectation of 52.5. Subsequently, markets grew more confident of a September cut from the Federal Reserve (Fed) which weighed on the USD.
Anticipation grows for the US labor market figures, notably the Nonfarm Payrolls for June and Unemployment and wage inflation figures due on Friday. These figures have drawn enhanced scrutiny due to growing concerns among Fed officials about the health of the labor market and may shift the expectations of the timing of the easing cycle.
On the Swiss front, the June Consumer Price Index (CPI) announced on Thursday showed a decline to 1.3% YoY vs the 1.4% YoY expected. The Core slightly declined to 1.1% the 1.2% expected. The lower inflation might give scope to the SNB to ease further. Hence, market odds for a September interest-rate cut by the SNB exceeded 50%.
USD/CHF technical analysis
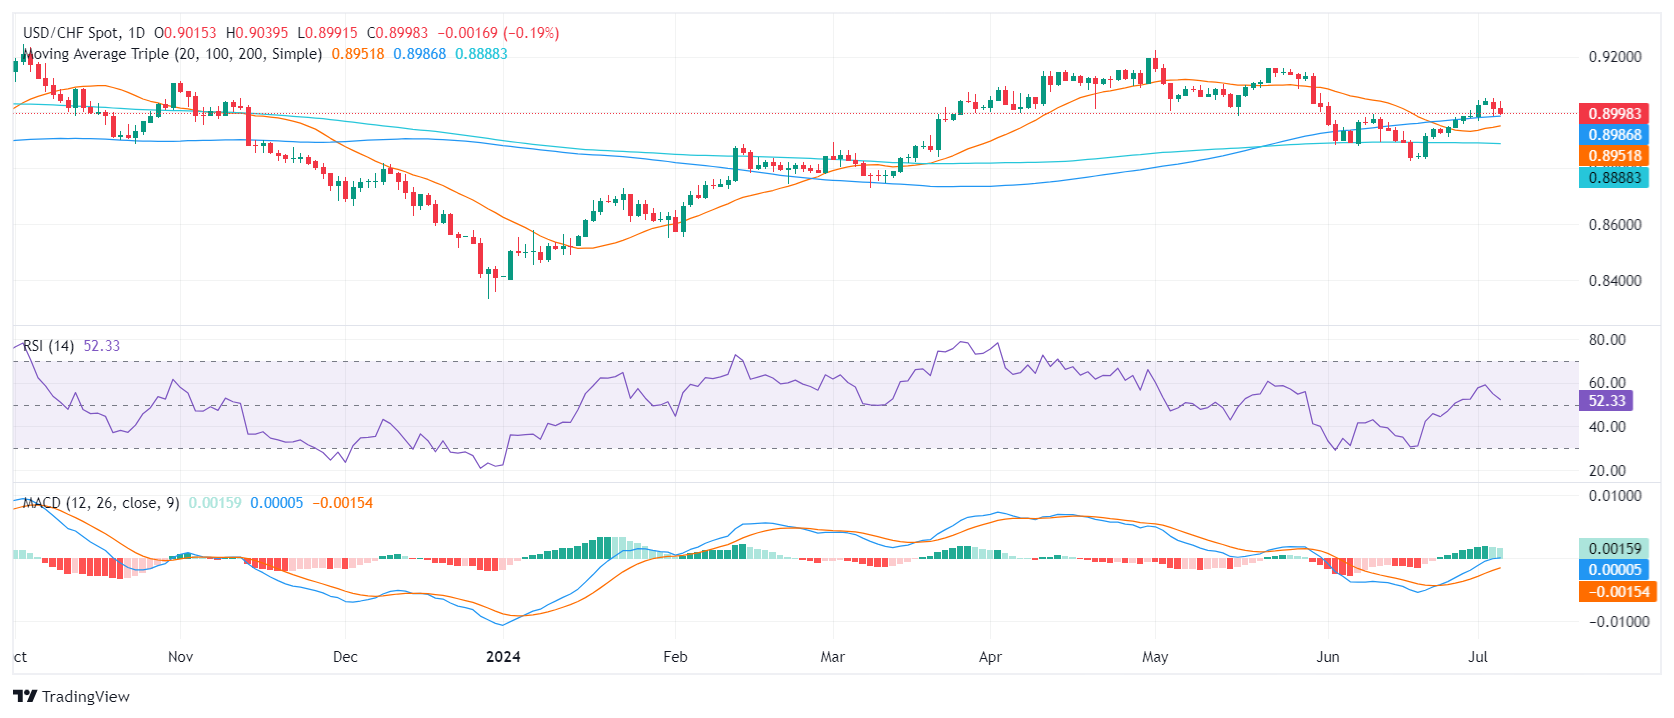
The technical outlook turned somewhat negative in the short term. The currency pair cut a promising six-day streak, with indicators including the Moving Average Convergence Divergence (MACD) and Relative Strength Index (RSI) losing momentum. Main supports lie at the 100-day Simple Moving Average (SMA) at 0.8985, followed by the 20-day SMA at 0.8950. The immediate target for the buyers remains at 0.9040.
USD/CHF daily chart
Recommended Articles


