NZD/JPY Price Analysis: Bullish momentum gains as bears failed to conquer the 20-day SMA

Source Fxstreet
  • The NZD/JPY's daily RSI reveals a transition towards positive territory, indicating a growing buying momentum.
  • Both daily and hourly MACD portray a neutral scenario with their flat green bars, neither favoring buyers nor sellers significantly.
  • Buyer's decisive support at the 20-day SMA in recent sessions indicates heightened bullish sentiment within the market.

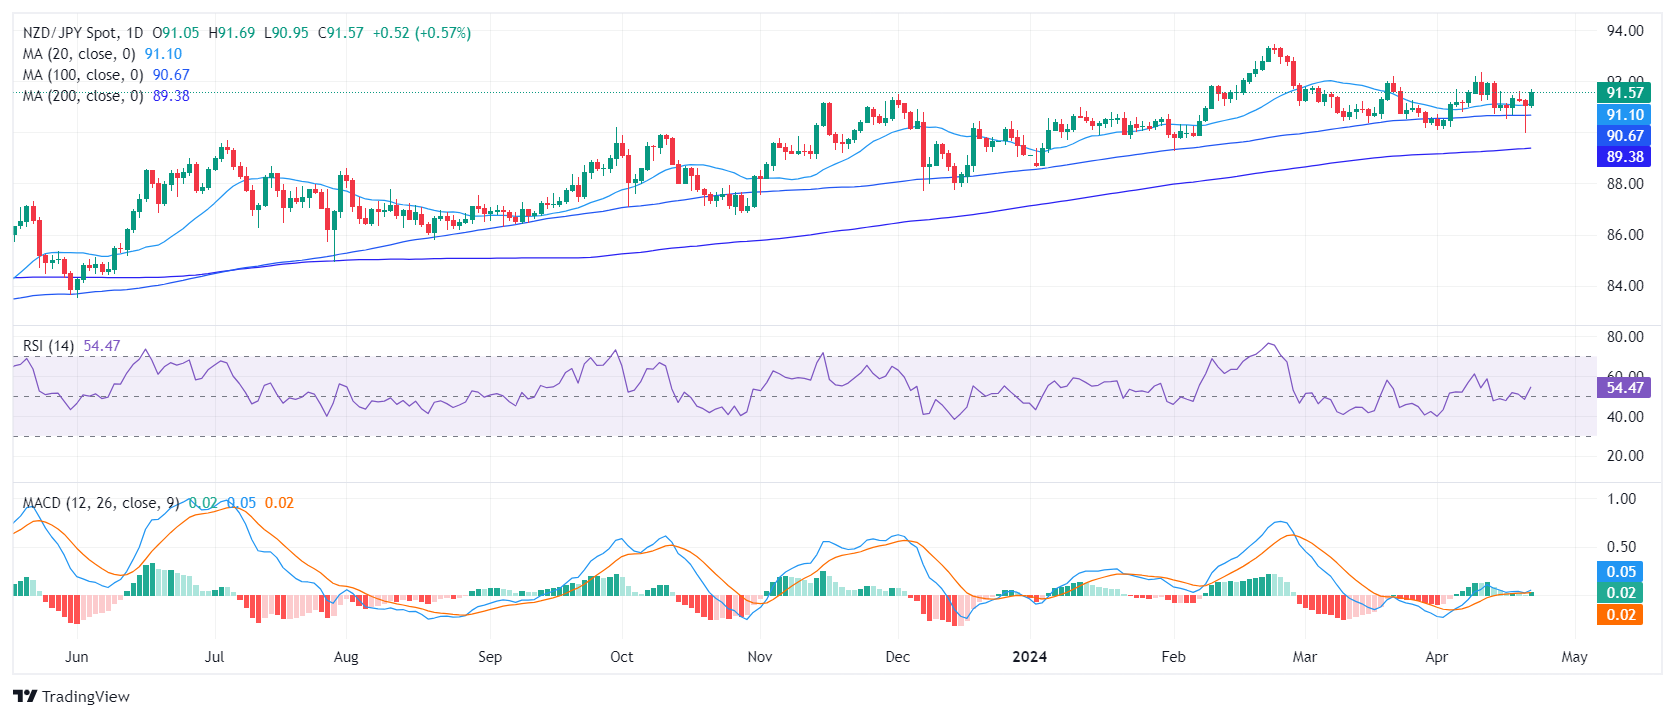
The NZD/JPY rose to 91.59 on Monday and maintains a steady uptrend. Indicators on the daily and hourly charts are favoring the buyers and as the bears failed to breach the 20-day Simple Moving Average (SMA), the outlook remains positive for the short term.

On the daily chart, the Relative Strength Index (RSI) reveals a transition from negative to positive territory, currently at 55. This shift shows a slight bullish momentum, indicating that traders are favoring more buying activities. The Moving Average Convergence Divergence (MACD) histogram exhibits flat green bars, suggesting a neutral momentum, neither favoring buyers nor sellers significantly.

NZD/JPY daily chart
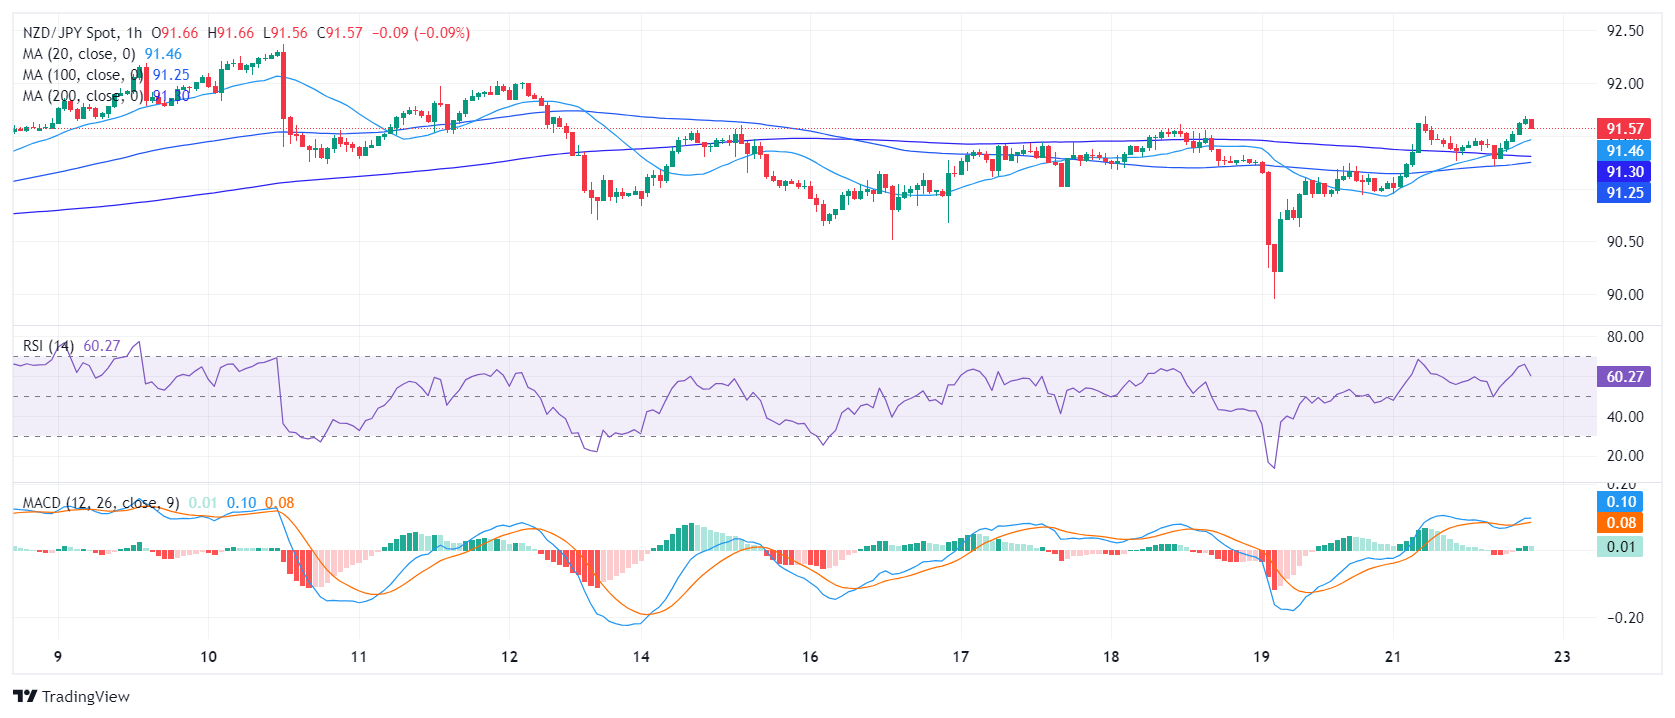
On the hourly chart, the RSI advances further into positive territory, peaking at 64 before slightly receding to 59. This movement signifies that buying activities have intensified during the American session. The MACD continues to exhibit flat green bars, mirroring the neutral momentum indicated on the daily chart.

NZD/JPY hourly chart
From a broader perspective, the NZD/JPY demonstrates a robust performance by situating above its key Simple Moving Averages (SMA), a technical indicator that averages the currency pair's closing prices over specific periods. Its stance above the 20, 100, and 200-day SMA suggests a consistent uptrend, representing both short-term and long-term strength. In the last sessions, the buyers defended the 20-day SMA at 91.10. This type of decisive support provides further evidence of a bullish sentiment among traders, which could stimulate more upside potential for the NZD/JPY.


NZD/JPY

Overview
Today last price 91.58
Today Daily Change 0.53
Today Daily Change % 0.58
Today daily open 91.05
 
Trends
Daily SMA20 91.07
Daily SMA50 91.42
Daily SMA100 90.67
Daily SMA200 89.36
 
Levels
Previous Daily High 91.32
Previous Daily Low 89.96
Previous Weekly High 91.62
Previous Weekly Low 89.96
Previous Monthly High 92.2
Previous Monthly Low 90.17
Daily Fibonacci 38.2% 90.48
Daily Fibonacci 61.8% 90.8
Daily Pivot Point S1 90.23
Daily Pivot Point S2 89.42
Daily Pivot Point S3 88.88
Daily Pivot Point R1 91.59
Daily Pivot Point R2 92.13
Daily Pivot Point R3 92.95


Disclaimer: For information purposes only. Past performance is not indicative of future results.
placeholder
EURUSD Long-term Forecast: Can ECB Hawks Overcome the Dollar Bullishness? As one of the most traded currency pair in the forex markets, the price of EURUSD affects many traders. Check out our EURUSD long-term forecast for more information.
Author  Mitrade
Mar 13, 2023
As one of the most traded currency pair in the forex markets, the price of EURUSD affects many traders. Check out our EURUSD long-term forecast for more information.
placeholder
AUDUSD Long-term Forecast: Bulls to Get Energy from RBAThe Australian Dollar has been through a upward trend since 2022. Will it continue its upward trend in the long-term?
Author  Mitrade
Mar 13, 2023
The Australian Dollar has been through a upward trend since 2022. Will it continue its upward trend in the long-term?
placeholder
Copper Long-term forecast: Will Copper Price Expected To Soar In 2023?The price of copper is affected by various of factors. You may wonder how the price of cooper will be in 2023, check out our forecast analysis.
Author  Mitrade
Mar 13, 2023
The price of copper is affected by various of factors. You may wonder how the price of cooper will be in 2023, check out our forecast analysis.
placeholder
Natural Gas sinks to pivotal level as China’s demand slumpsNatural Gas price (XNG/USD) edges lower and sinks to $2.56 on Monday, extending its losing streak for the fifth day in a row. The move comes on the back of China cutting its Liquified Natural Gas (LNG) imports after prices rose above $3.0 in June. It
Author  FXStreet
Jul 01, Mon
Natural Gas price (XNG/USD) edges lower and sinks to $2.56 on Monday, extending its losing streak for the fifth day in a row. The move comes on the back of China cutting its Liquified Natural Gas (LNG) imports after prices rose above $3.0 in June. It
placeholder
Why Cisco Systems Stock Zoomed More Than 4% Higher TodayAn analyst recommendation upgrade was the news propelling the stock of Cisco Systems (NASDAQ: CSCO) skyward on Wednesday. Investors took the bullish new rating to heart, pushing into shares of the veteran computer networking company and sending them more than 4% higher in price.
Author  The Motley Fool
Yesterday 02: 32
An analyst recommendation upgrade was the news propelling the stock of Cisco Systems (NASDAQ: CSCO) skyward on Wednesday. Investors took the bullish new rating to heart, pushing into shares of the veteran computer networking company and sending them more than 4% higher in price.
Related Instrument
goTop
quote