NZD/JPY Price Analysis: Negative momentum gains traction, broader outlook still positive

Source Fxstreet
  • The daily chart RSI signals NZD/JPY's shift towards negative momentum.
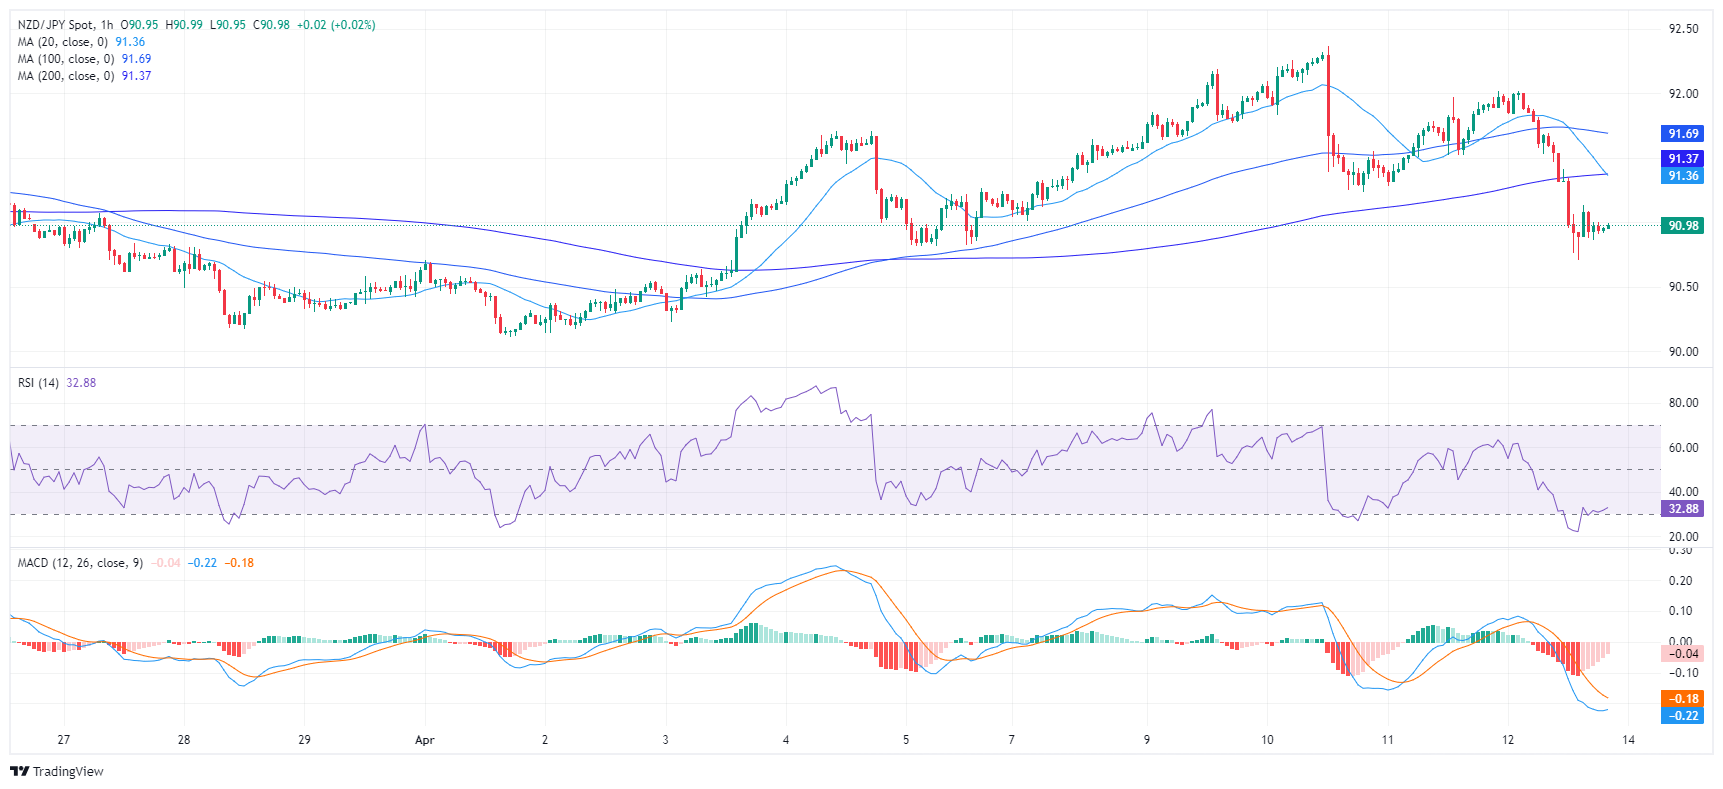
  • Hourly RSI reveals an oscillating pattern in oversold territory, indicating increasing bearish pressure.

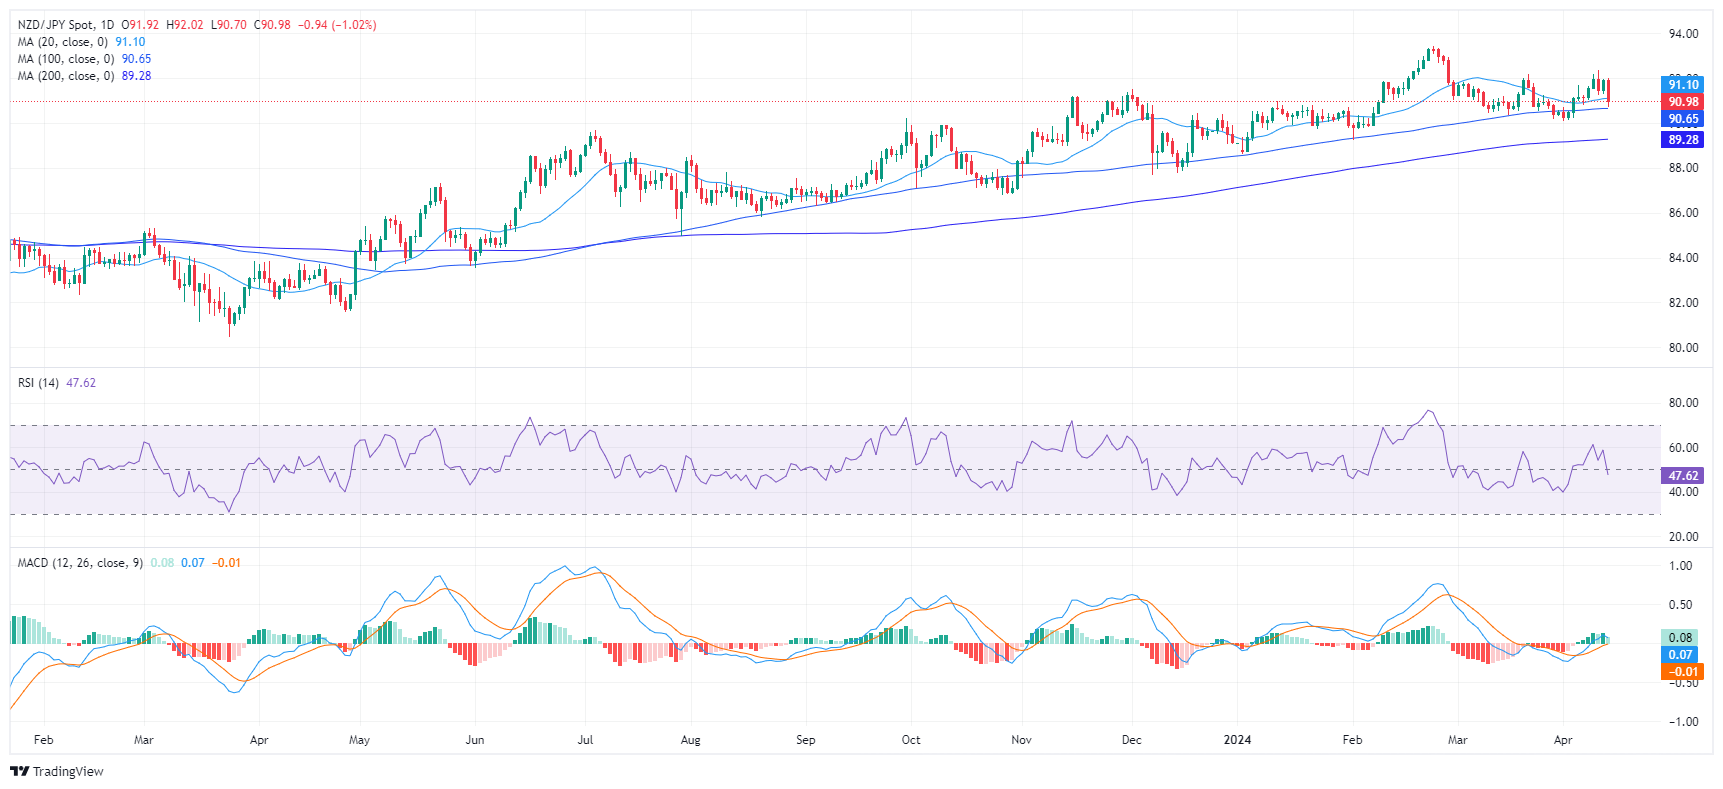
The NZD/JPY declined to 90.95 on Friday, marking a decrease of 1%. Sellers have gained significant ground and hourly indicators indicate oversold conditions which suggests that the pair might sideways trade in the next sessions. As for now, the short term has turned somewhat bearish for the cross as it lost the 20-day Simple Moving Average (SMA).

Based on the indicators of the daily chart, the NZD/JPY has pivoted towards a negative momentum. Its Relative Strength Index (RSI) is settling into negative territory, with a last reading of 47. This change indicates that sellers are taking control after a period of positive strength that had the RSI peaking at 63 this week.

NZD/JPY daily chart
From the hourly chart, the RSI values reveal oversold conditions, with the most recent reading dipping to 30. The Moving Average Convergence Divergence (MACD) histogram generates flat red bars, signaling sustained negative momentum. This coincides with a drop in buyer demand over the past hours, and it could set the tone for the upcoming trading sessions. However, a consolidation shouldn't be ruled out as bears might take a breather.

NZD/JPY hourly chart
In the broader outlook, the NZD/JPY, based on its Simple Moving Average (SMA) still holds a positive outlook as it holds above the 100 and 200-day SMAs. However, the cross, having fallen today below the 20-day SMA, presents a bearish signal for the short term which aligns with the indicators on the daily and hourly chart.


NZD/JPY

Overview
Today last price 90.95
Today Daily Change -0.97
Today Daily Change % -1.06
Today daily open 91.92
 
Trends
Daily SMA20 91.09
Daily SMA50 91.35
Daily SMA100 90.65
Daily SMA200 89.26
 
Levels
Previous Daily High 91.97
Previous Daily Low 91.28
Previous Weekly High 91.7
Previous Weekly Low 90.11
Previous Monthly High 92.2
Previous Monthly Low 90.17
Daily Fibonacci 38.2% 91.71
Daily Fibonacci 61.8% 91.55
Daily Pivot Point S1 91.47
Daily Pivot Point S2 91.03
Daily Pivot Point S3 90.78
Daily Pivot Point R1 92.17
Daily Pivot Point R2 92.42
Daily Pivot Point R3 92.86


Disclaimer: For information purposes only. Past performance is not indicative of future results.
placeholder
ADP Employment Change projected to show meager US job growth in JuneThe ADP Research Institute is poised to release its June Employment Change report on Wednesday, and it will explore the dynamics of private sector job gains.
Author  FXStreet
Jul 02, Wed
The ADP Research Institute is poised to release its June Employment Change report on Wednesday, and it will explore the dynamics of private sector job gains.
placeholder
Bitcoin ETF Inflows For 2025 Now Outpace 2024, Data ShowsUS Bitcoin spot exchange-traded funds (ETFs) have seen more inflows this year so far compared to the same point in 2024, according to data.
Author  Bitcoinist
Jul 16, Wed
US Bitcoin spot exchange-traded funds (ETFs) have seen more inflows this year so far compared to the same point in 2024, according to data.
placeholder
ADP Employment Change is likely to increase concerns about the US labour marketThe ADP and NFP reports will serve as indicators of US employment this week, the canary in the cage for the Fed’s policy.
Author  FXStreet
Sep 04, Thu
The ADP and NFP reports will serve as indicators of US employment this week, the canary in the cage for the Fed’s policy.
placeholder
Gold Price Forecast: XAU/USD gains momentum to near $3,650, eyes on US CPI releaseThe Gold price (XAU/USD) gains momentum to near $3,645 during the early Asian session on Thursday.
Author  FXStreet
Sep 11, Thu
The Gold price (XAU/USD) gains momentum to near $3,645 during the early Asian session on Thursday.
placeholder
Bitcoin and Ether face volatility as $5.3B options expireBTC, ETH options for a total of $5.3B are expiring on Friday, bringing another period of potential price volatility.
Author  FXStreet
Oct 09, Thu
BTC, ETH options for a total of $5.3B are expiring on Friday, bringing another period of potential price volatility.
Related Instrument
goTop
quote