AUD/JPY Price Analysis: Aussie soars, buyers start to back off on the hourly chart

Source Fxstreet
  • The daily chart presents a strong buying momentum with indicators deep in positive territory.
  • On the hourly chart, the RSI resides in the overbought zone, suggesting a short-term consolidation of the recent gains.

In Wednesday's session, the AUD/JPY pair is trading at 99.58, following an increase of 0.82%. Buyers appear in control, but indicators are flashing signals of a short-term consolidation.

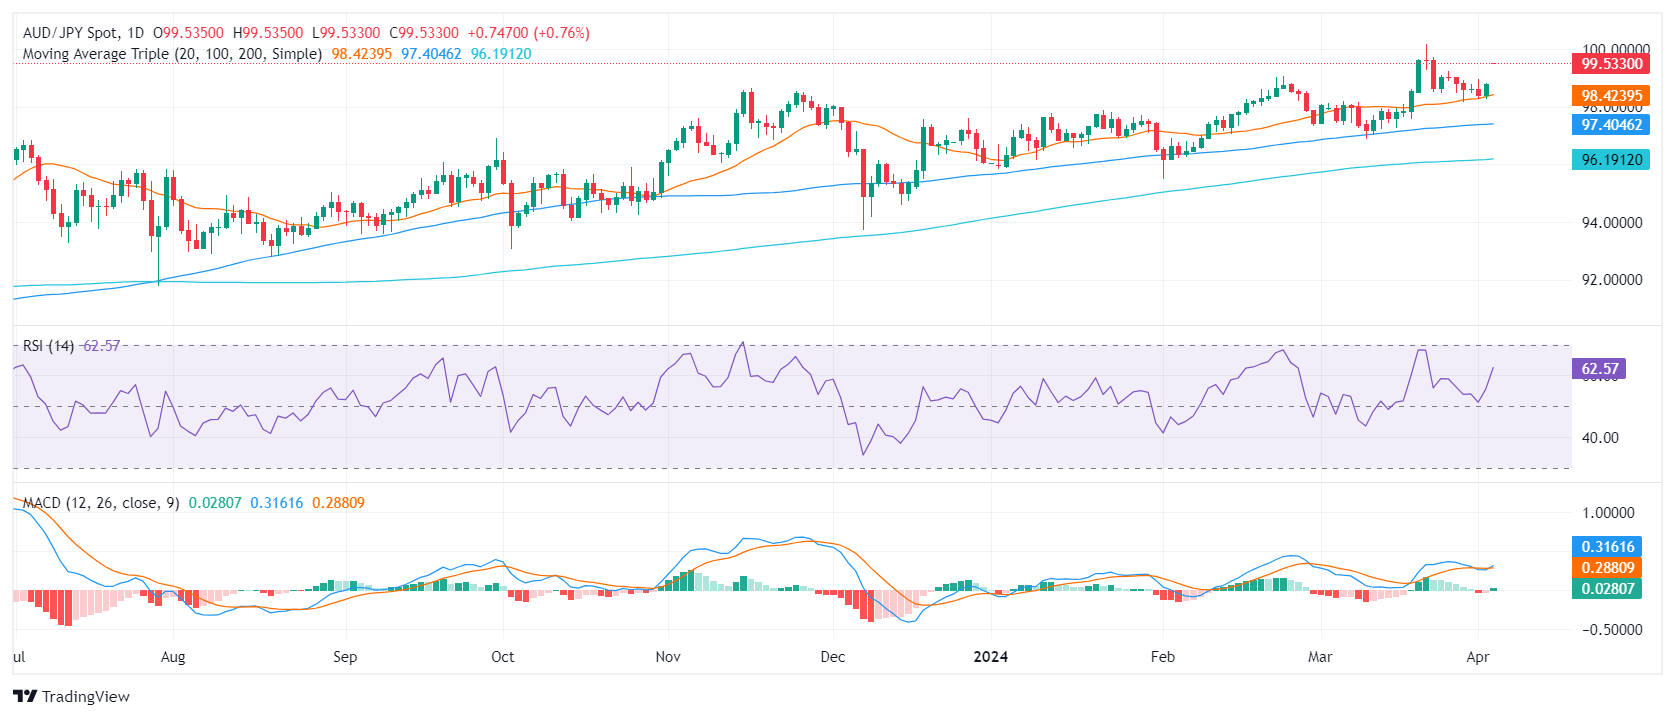
On the daily chart, the AUD/JPY pair reveals a bullish sentiment. The Relative Strength Index (RSI) resides deep in positive territory, with recent readings reaching as high as 61, indicating the domination of buyers in the market. Furthermore, the rising green bars on the Moving Average Convergence Divergence (MACD) histogram show a positive momentum, supporting the bullish outlook.

AUD/JPY daily chart
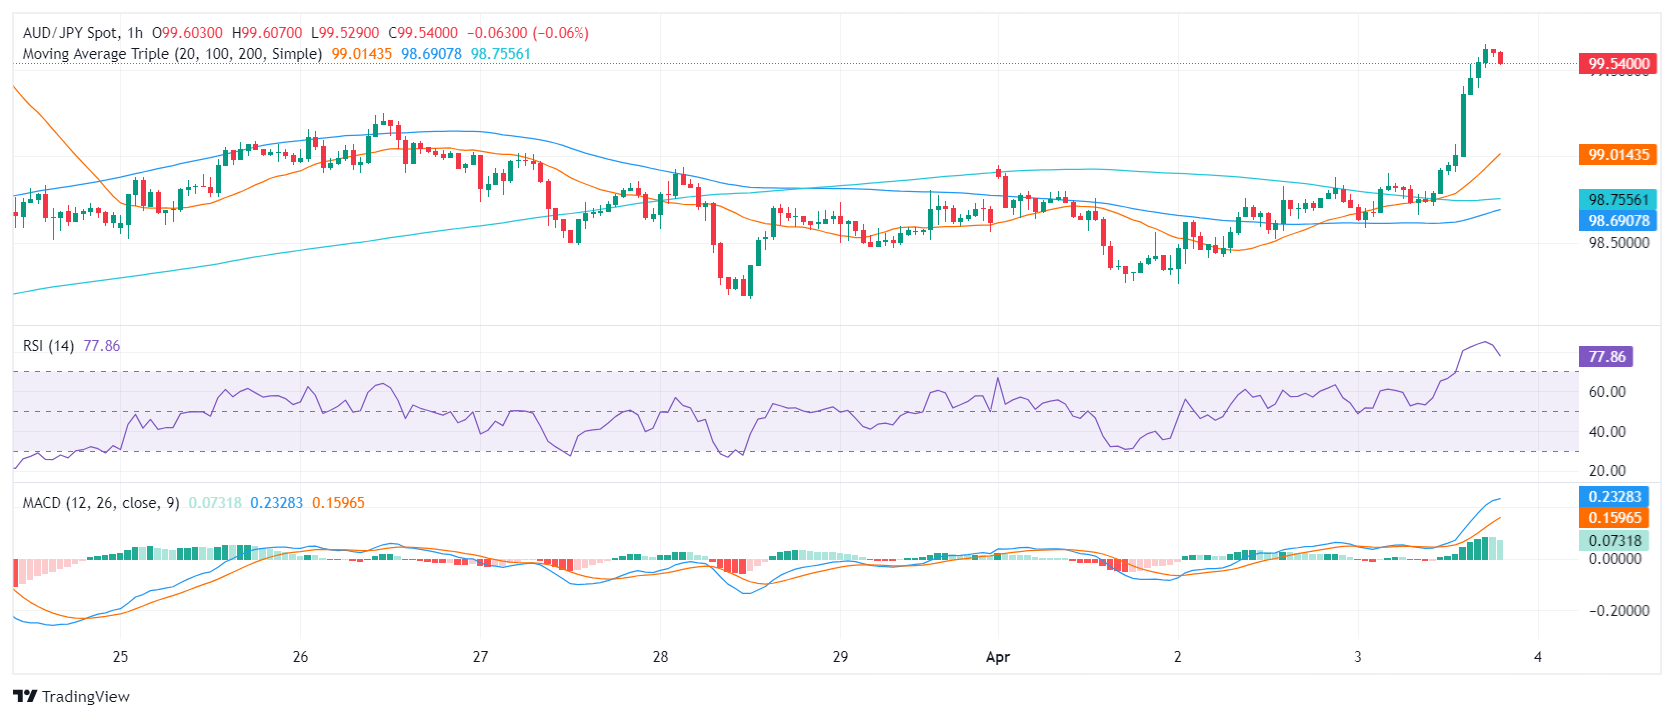
Upon inspecting the hourly chart, the RSI readings consistently hover in the overbought zone, with the latest entry at 78 but the index has started to edge downwards. A flat green histogram on the MACD also gives arguments for a short-term consolidation.

AUD/JPY hourly chart
Considering the broader outlook, the pair also stands above the 20,100 and 200-day Simple Moving Averages (SMAs). This setup suggests short-term and long-term trends are bullish, and traders may expect further upside.

In conclusion, both daily and hourly charts for the AUD/JPY pair highlight a bullish outlook. The RSI values and the MACD histograms across both timelines point to strong upward movement, with buyers currently holding market reins. However, indicators on the hourly chart point to further consolidation as they lie deep in the overbought zone.

AUD/JPY

Overview
Today last price 99.53
Today Daily Change 0.74
Today Daily Change % 0.75
Today daily open 98.79
 
Trends
Daily SMA20 98.35
Daily SMA50 97.87
Daily SMA100 97.39
Daily SMA200 96.17
 
Levels
Previous Daily High 98.83
Previous Daily Low 98.26
Previous Weekly High 99.25
Previous Weekly Low 98.18
Previous Monthly High 100.17
Previous Monthly Low 96.9
Daily Fibonacci 38.2% 98.61
Daily Fibonacci 61.8% 98.48
Daily Pivot Point S1 98.42
Daily Pivot Point S2 98.06
Daily Pivot Point S3 97.86
Daily Pivot Point R1 98.99
Daily Pivot Point R2 99.19
Daily Pivot Point R3 99.55


Disclaimer: For information purposes only. Past performance is not indicative of future results.
placeholder
ASML Crushes Q4 2024 Earnings: What are the Key Takeaways for Investors?In a big week for Big Tech earnings, semiconductor equipment giant ASML Holding NV (NASDAQ: ASML) reported its latest Q4 2024 earnings on Wednesday (29 January) before the market open in the US.ASML e
Author  TradingKey
Jan 31, Fri
In a big week for Big Tech earnings, semiconductor equipment giant ASML Holding NV (NASDAQ: ASML) reported its latest Q4 2024 earnings on Wednesday (29 January) before the market open in the US.ASML e
placeholder
December JOLTS Report Preview: Will the Labour Market Cool or Stay Hot?TradingKey - Investors looking towards the potential for interest rate cuts by the US Federal Reserve (Fed) are studying a variety of incoming data points. One of the many important ones is the JOLTS
Author  TradingKey
Yesterday 02: 31
TradingKey - Investors looking towards the potential for interest rate cuts by the US Federal Reserve (Fed) are studying a variety of incoming data points. One of the many important ones is the JOLTS
placeholder
Bitcoin tumbles to $97k as markets start to crash amid trade war concernsBitcoin’s price crashed to $97,000 today, down from highs of $109,500, as global financial markets see a widespread decline. Traders are scrambling to cover their positions after US President Donald Trump announced 10% tariffs on China, and 25% each for Mexico and Canada on Feb. 1. Now February has historically always been a bullish month, […]
Author  Cryptopolitan
Yesterday 02: 38
Bitcoin’s price crashed to $97,000 today, down from highs of $109,500, as global financial markets see a widespread decline. Traders are scrambling to cover their positions after US President Donald Trump announced 10% tariffs on China, and 25% each for Mexico and Canada on Feb. 1. Now February has historically always been a bullish month, […]
placeholder
Where Will Nvidia Stock Be in 3 Years?If you held on to Nvidia (NASDAQ: NVDA) stock for the last three years, you are probably laughing all the way to the bank. A $10,000 bet made in early 2022 would be worth almost $5
Author  The Motley Fool
Yesterday 02: 49
If you held on to Nvidia (NASDAQ: NVDA) stock for the last three years, you are probably laughing all the way to the bank. A $10,000 bet made in early 2022 would be worth almost $5
placeholder
Bitcoin could be included in newly approved sovereign wealth fundPresident Donald Trump signed an executive order on Monday that details plans for the creation of a sovereign wealth fund for the development of the US economy, drawing the attention of crypto experts who believe that the fund could include Bitcoin.
Author  FXStreet
1 hour ago
President Donald Trump signed an executive order on Monday that details plans for the creation of a sovereign wealth fund for the development of the US economy, drawing the attention of crypto experts who believe that the fund could include Bitcoin.
Related Instrument
goTop
quote