

US Treasury yields climb amid central bank policymakers speeches

Mitrade
coverImg
Source: DepositPhotos
  • Futures market adjusts expectations, reducing bets on quick Fed rate cuts, leading to a rise in US Treasury yields across various maturities.


  • Atlanta Fed President Bostic and Fed Governor Waller emphasize a measured approach to rate cuts, citing risks of inflation and policy calibration.


  • Inversion in US Treasury yield curve deepens, signaling potential recession concerns, while key US economic data and Fed speeches loom this week.


US Treasury yields rose across the board as interest rate traders in the futures market trimmed their bets that the US Federal Reserve (Fed) would c

ut rates as quickly as expected. Global bond yields are climbing as central bankers from the Federal Reserve (Fed) push back against market participants' projections that they would relax monetary policy even though the risks of overtightening have emerged.


US bond yields rise as Fed officials signal slower rate cuts

Over the weekend, the Atlanta Fed president Raphael Bostic warned that a “second wave” of inflation could emerge should the central banks cut rates too soon and warned that getting inflation towards the Fed’s 2% target would take some time, according to the Financial Times.

Bostic added that he expects inflation progress to slow down, adding that there were “some risks that inflation may stall out altogether.”


Recently, Fed Governor Christopher Waller commented the Fed is in no rush to easy policy as inflation is “within striking distance.” Although he supports the idea of cutting rates, he warned that until any risks of inflation resurging have subsided, policy changes should “be carefully calibrated and not rushed.”


Following the Fed’s Waller speech, Fed funds futures traders expect a 65% chance of 25 basis points, lower than the 76.9% expected yesterday.


The US 10-year Treasury note climbed 12 basis points, up to 4.07%, while the 2-year note rose 9 basis points at 4.24%. Even though the short and the mid-term of the curve are rising, the US 10s-2s yield curve disinsertion continued, as the spread hit its highest level since October of 2023, at -0.163%. When inverted, that part of the US Treasury yield curve Is usually seen as a warning sign of an upcoming recession.


Ahead of the week, the US economic docket will feature US Retail Sales and Industrial Production housing data and Fed speeches on Wednesday. On Thursday, Initial Jobless Claims and further Fed speakers would cross the wires, followed by Friday’s University of Michigan (UoM) Consumer Sentiment.
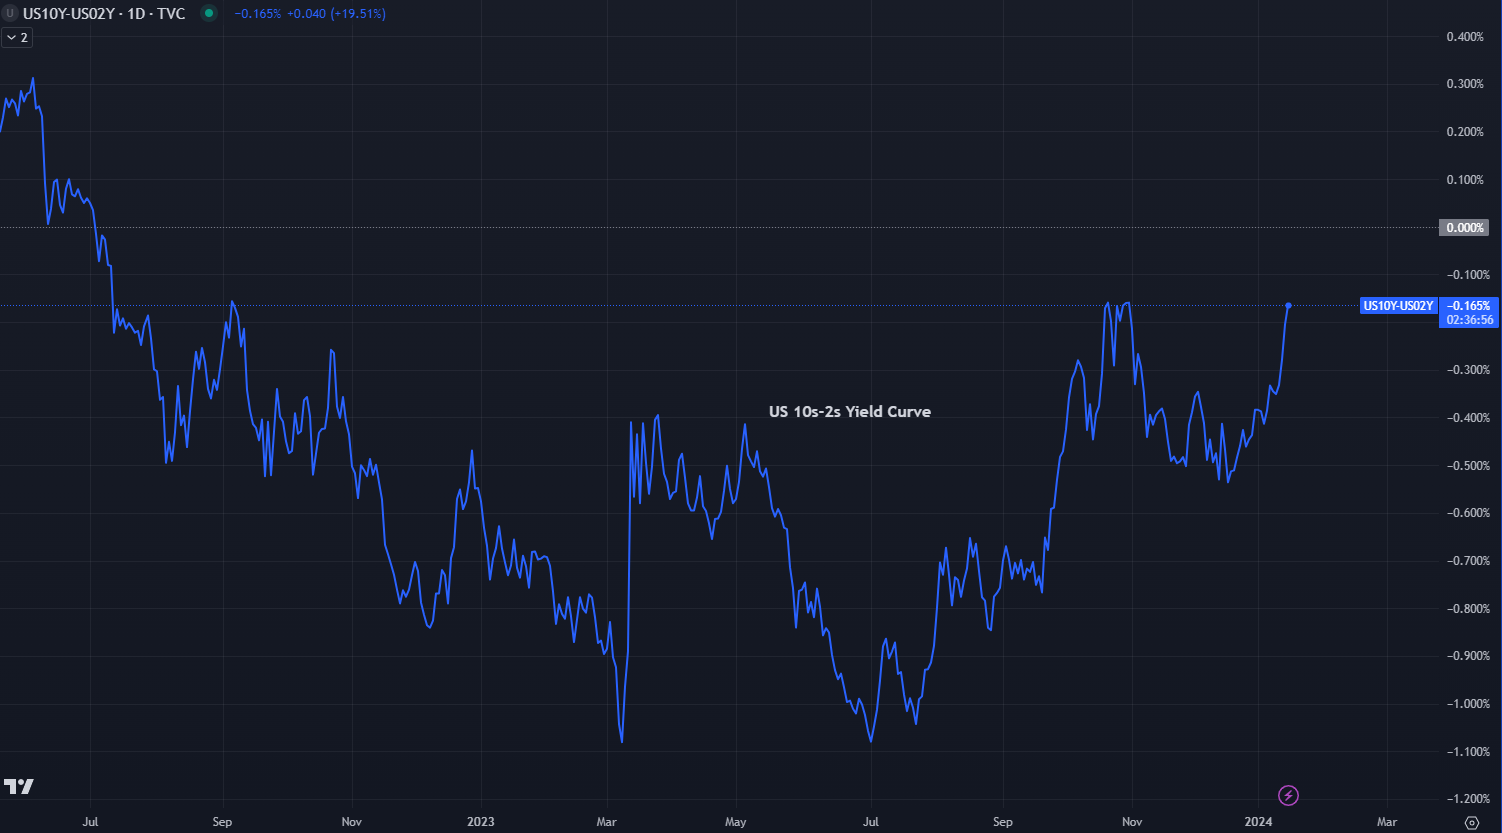

US 10s-2s Yield spread chart


* The content presented above, whether from a third party or not, is considered as general advice only.  This article should not be construed as containing investment advice, investment recommendations, an offer of or solicitation for any transactions in financial instruments.

goTop
quote
Related Articles
placeholder
US September CPI preview: inflation set to hit 3.7% — will the Fed hike in December?US September CPI lands Wednesday with headline inflation seen at 3.7% y/y and core at 0.2% m/m. December hike odds sit near 70% — here are the scenarios, the calendar and the key levels.
Author  Irene Q.
Oct 10, Sat
US September CPI lands Wednesday with headline inflation seen at 3.7% y/y and core at 0.2% m/m. December hike odds sit near 70% — here are the scenarios, the calendar and the key levels.
placeholder
The 30-year Treasury just hit a 22-year high — and the bond market is not pricing the Fed, it is pricing the deficitThe 30-year Treasury yield closed at 5.56% on 28 September, the highest since June 2004, while the 10-year reached 5.24% and the 20-year 5.60%. The curve has steepened roughly 30bp in eight sessions even as October hike odds sit at 70.3%. That gap is the story: the long end is repricing fiscal and inflation risk, not policy. With PCE on Wednesday and payrolls on Friday, here is what the long end is really saying.
Author  Irene Q.
Sep 29, Tue
The 30-year Treasury yield closed at 5.56% on 28 September, the highest since June 2004, while the 10-year reached 5.24% and the 20-year 5.60%. The curve has steepened roughly 30bp in eight sessions even as October hike odds sit at 70.3%. That gap is the story: the long end is repricing fiscal and inflation risk, not policy. With PCE on Wednesday and payrolls on Friday, here is what the long end is really saying.
placeholder
U.S. September Nonfarm Payrolls: Two-Scenario Analysis, Will U.S. Stocks Diverge in Short-Term and Medium-to-Long-Term Trends?1. IntroductionAffected by the U.S. government shutdown, the September nonfarm payrolls report—originally scheduled for release in early October—will be officially published on 20 November. As a key "
Author  TradingKey
Nov 18, 2025
1. IntroductionAffected by the U.S. government shutdown, the September nonfarm payrolls report—originally scheduled for release in early October—will be officially published on 20 November. As a key "
placeholder
Bank of Japan Preview: Forecasts from eight major banks, BoJ to maintain the status quo and remain dovishThe Bank of Japan (BoJ) will hold its Monetary Policy Committee (MPC) on Tuesday, January 23 and as we get closer to the Interest Rate Decision, here are the expectations forecast by the economists and researchers of eight major banks.
Author  FXStreet
Jan 23, 2024
The Bank of Japan (BoJ) will hold its Monetary Policy Committee (MPC) on Tuesday, January 23 and as we get closer to the Interest Rate Decision, here are the expectations forecast by the economists and researchers of eight major banks.
placeholder
Gold defends $4,100 as BofA targets a break below $4,000 — why the Middle East bid is missingSpot gold flushed to $4,099.89, a whisker above October's $4,090 low, then rebounded to close at $4,138.25 (+0.82%) — even as US CPI ran hot. Bank of America sees gold below $4,000 within three months, citing shrinking demand and official-sector selling. Here are the levels, the drivers and what would flip the script.
Author  Irene Q.
Oct 15, Thu
Spot gold flushed to $4,099.89, a whisker above October's $4,090 low, then rebounded to close at $4,138.25 (+0.82%) — even as US CPI ran hot. Bank of America sees gold below $4,000 within three months, citing shrinking demand and official-sector selling. Here are the levels, the drivers and what would flip the script.
Live Quotes
Name / SymbolChart% Change / Price
US500
US500
0.00%0.00

Indicator Related Articles

  • Top 10 Must-Have Forex Technical Indicators That Every Trader Should Use

Click to view more