
Are you new to forex trading and wondering which technical indicators to use?
Or have you been trading for a while but want to improve your strategies?
Whatever the case, choosing the right technical indicators can be crucial to your success in the forex market.
In this article, we'll take a closer look at some of the best forex technical indicators and how they can be used to enhance your trading strategies.
What are technical indicators?
If you're new to forex trading, technical indicators sound like something from a Star Trek movie.
But don't worry; they're not as complicated as they seem!
Simply put, technical indicators are mathematical calculations based on historical price and volume data that help traders analyze the market. Their calculations are based on historical patterns.
You apply these indicators to charts to visually represent market trends, patterns, and potential entry and exit points.
There are various types of technical indicators, including trend indicators, momentum indicators, volatility indicators, and volume indicators. Each type of indicator has its unique calculation methods, along with its pros and cons.
Here's how they work:
Trend indicators are used to identify the direction of the market trend.
Momentum indicators measure the strength of market trends and help determine potential trend reversals.
Volatility indicators measure the range of price movements in the market.
Volume indicators measure the number of trades taking place.
Fun fact: Did you know that the concept of technical indicators dates back to the 17th century?
The Japanese rice trader, Homma Munehisa, developed the first version of technical analysis, known as candlestick charts. Over time, candlestick charts evolved into technical indicators we use today.
Fast execution | Trade on rising and falling Market | 24-hour trading | Limit and stop loss for every trade

Top 10 Powerful Forex technical indicators
Let’s move on to the juicy part of the article and talk about the 10 best forex technical indicators.
1. Moving average
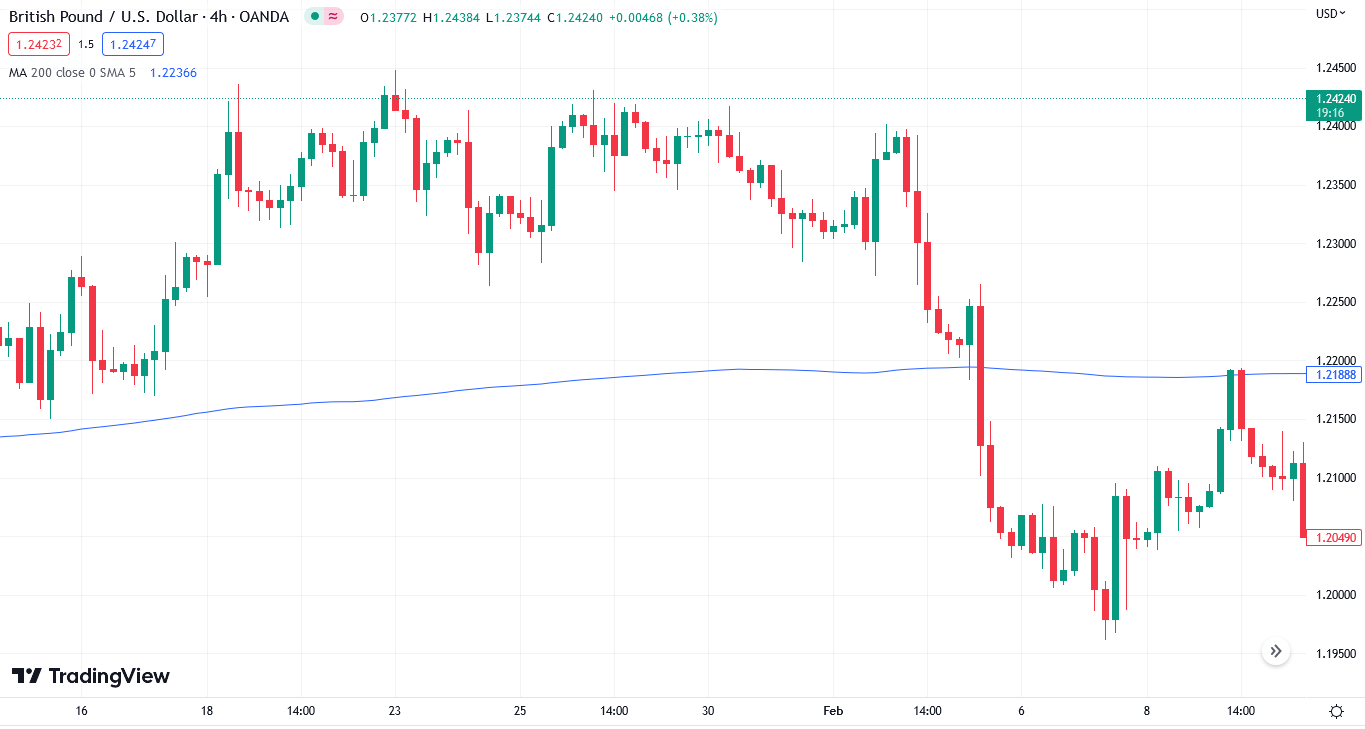
Moving averages (MA) are one of the most popular indicators in forex trading. They belong to a family of trend indicators and indicate the overall market trend.
When discussing the calculation, a moving average is a simple calculation that takes the average price of a currency pair over a specific period. The most commonly used periods are 20, 50, 100, and 200 days.
You can use the MA in various strategies. When the price crosses below or above the MA, it may signal a potential change in trend.
Another common strategy is to combine the two MAs.
When the short-term MA crosses above the long-term MA, it's considered a bullish signal. Conversely, when the short-term MA crosses below the long-term MA, it's a sign of a downtrend.
There are different types of MAs you can use, including:
EMA (Exponential Moving Average)
SMA (Simple Moving Average)
WMA (Weighted Moving Average)
VWMA (Volume Weighted Moving Average)
Their calculation differs slightly from the traditional Moving Average, but the concept remains the same.
Moving Average
2. Ichimoku
Did you know Ichimoku was developed by a Japanese journalist named Goichi Hosoda in the late 1930s?
The indicator's full name, Ichimoku Kinko Hyo, roughly translates to "one glance equilibrium chart" in Japanese.
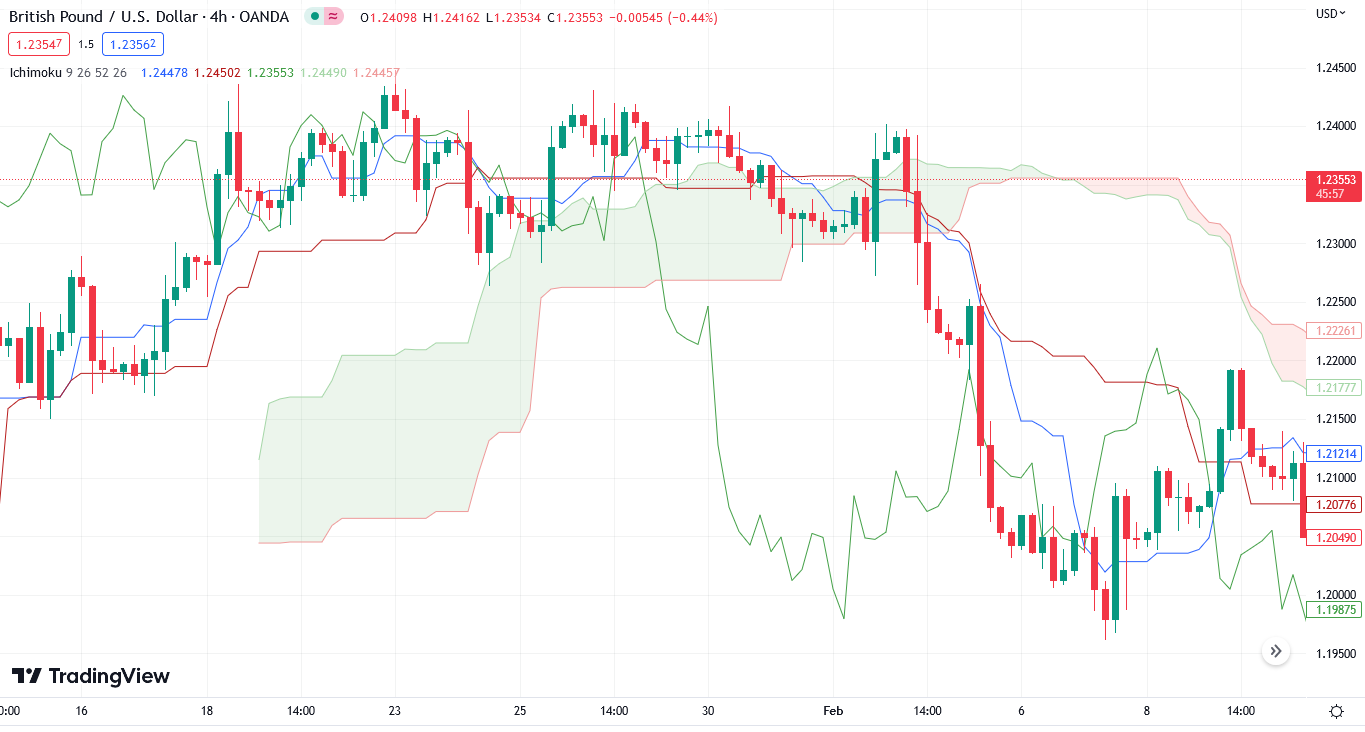
The Ichimoku indicator is unique because it contains five lines plotted on a price chart. These lines provide you with a more comprehensive view of the market and help identify potential trends and market reversals.
The 5 lines of the Ichimoku indicator are:
Tenkan-sen: This is the faster-moving average line, calculated by averaging the highest and lowest low over the last nine periods.
Kijun-sen: This is the slower-moving average line, calculated by averaging the highest and lowest low over the last 26 periods.
Senkou Span A: Span A represents the midpoint between the Tenkan-sen and Kijun-sen lines and is plotted 26 periods ahead.
Senkou Span B: This line represents the midpoint of the highest high and the lowest low over the last 52 periods and is also plotted 26 periods ahead.
Chikou Span: This line illustrates the closing price of the current candle and is plotted 26 periods back.
The Ichimoku indicator can identify support and resistance levels and trend reversals. The crossover of the Tenkan-sen and Kijun-sen lines can be used to identify potential entry and exit points.
Additionally, the space between Senkou Span A and Senkou Span B can be used to identify areas of support or resistance.
Ichimoku
3. Relative Strength Index
Ah, the good Ol’ RSI!
RSI, or the Relative Strength Index, is another popular technical indicator used in forex trading. It identifies potential market trends and reversals. The indicator measures the strength of price movements by comparing the average gains and losses over a specific period.
The RSI calculations generate a value between 0 and 100, with values above 70 indicating that a forex pair is overbought and values below 30 illustrating an oversold condition.
You can use the RSI to identify potential entry and exit points. For example, if the RSI is above 70, it's considered overbought. Conversely, if the RSI is below 30, it's considered oversold.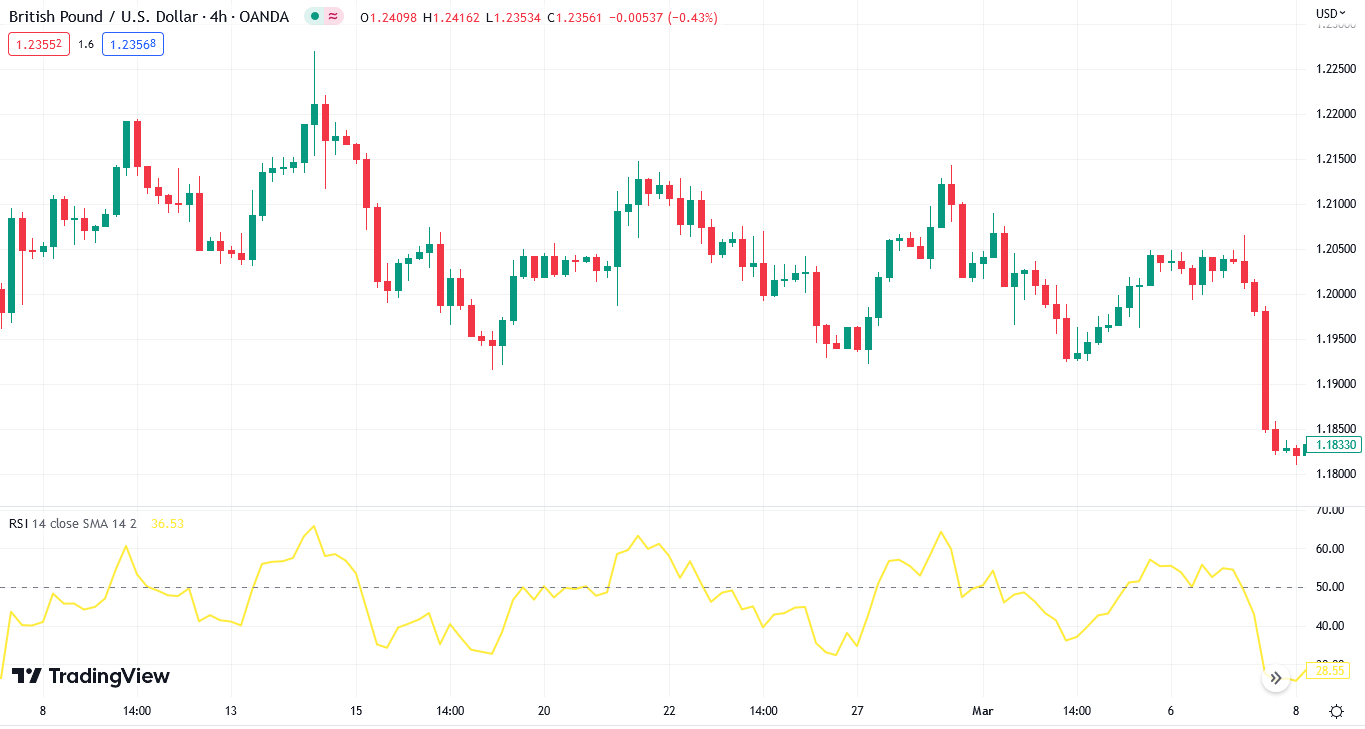
RSI
4. Stochastic
We have another momentum oscillator on our list! Like the RSI, the Stochastic determines the market trends and reversals.
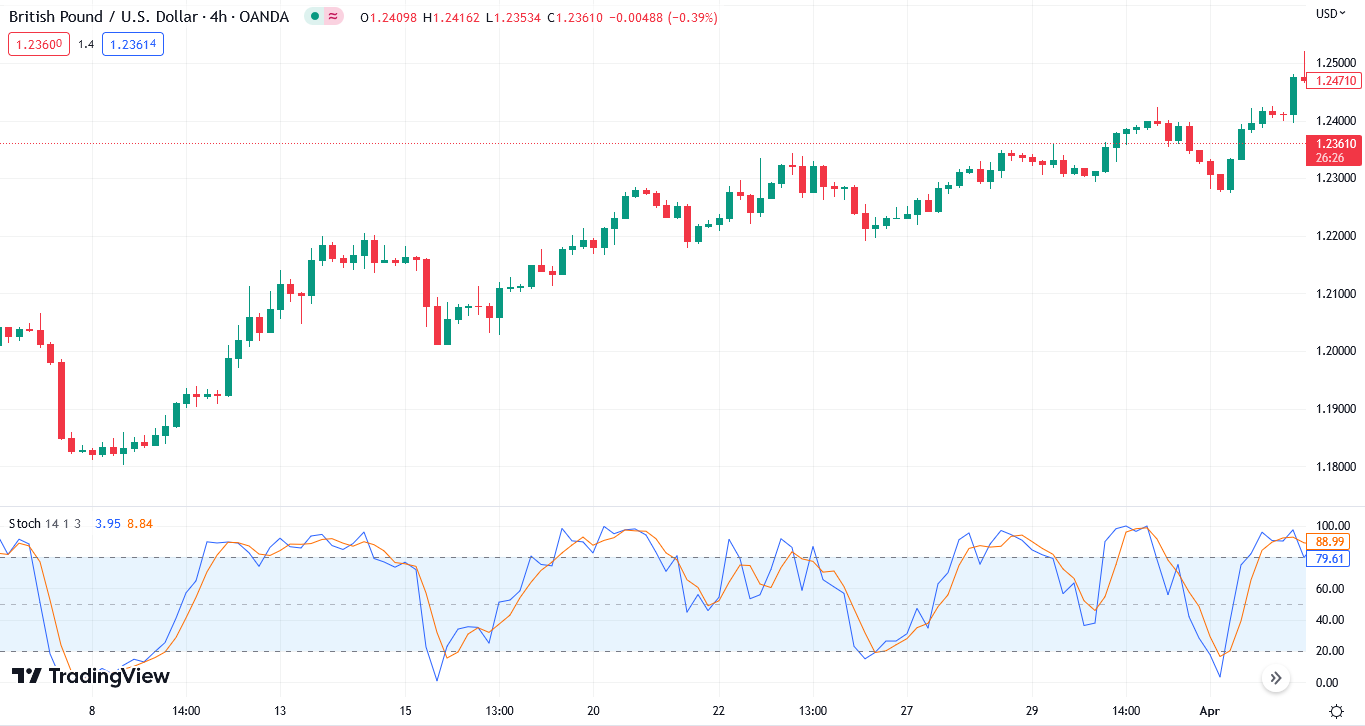
The Stochastic indicator consists of two lines: %K and %D. The %K line measures the current market momentum, while the %D line is a moving average of the %K line.
The indicator oscillates between 0 and 100, while values above 80 indicating an overbought condition and values below 20 are oversold.
Stochastic
5. Bollinger Bands
When you start trading, you'll always hear Bollinger Bands for every beginner tutorial you watch.
Bollinger Bands consist of three lines: the upper, lower, and middle bands, and measure the price volatility.
The upper and lower bands are calculated by adding and subtracting a multiple of the standard deviation of the price from the middle band.
The middle band is a simple moving price average over a specific period.
Bollinger Bands create a channel on the chart, with the upper and lower bands acting as support and resistance levels.
When the price moves toward the upper band, it's considered overbought, which may encounter a bearish reversal. Conversely, when the price moves toward the lower band, it's considered oversold, which may suggest a bullish reversal.

Bollinger Bands
6. ATR
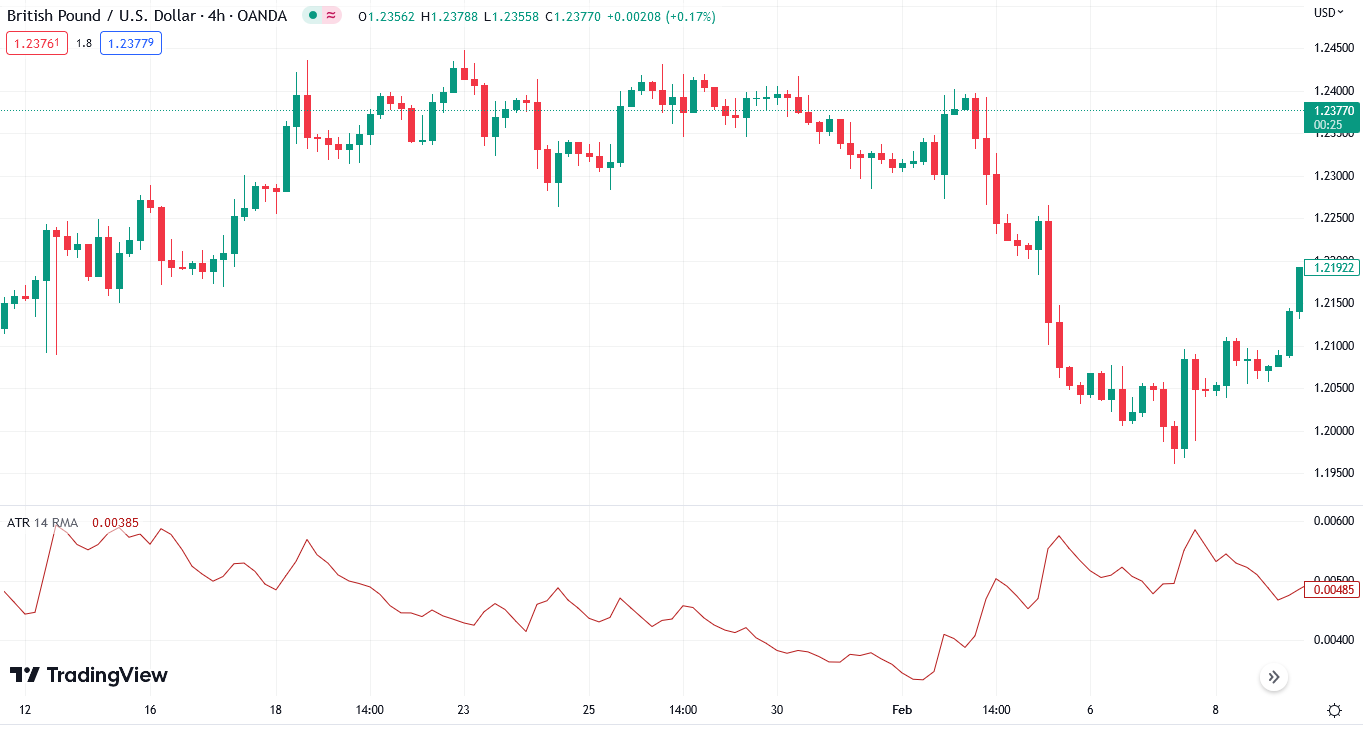
ATR, or Average True Range, is another technical indicator used in forex trading to measure volatility. Developed by J. Welles Wilder, ATR calculates the average range of price movement over a specific period.
If the ATR line is high, it indicates that the forex pair is experiencing high volatility. It's important to note that sharp price movements during high volatility, so using ATR allows you to adjust your strategies accordingly.
When the ATR line is low, it illustrates low volatility. Forex pairs tend not to move much during low volatility, so you should tweak your strategy based on the current market condition.
7. Fibonacci
The next one on our list is not exactly an indicator but a key technical analysis tool. The tool is based on the Fibonacci sequence, a series of numbers that appears in many natural phenomena, such as the branching of trees and spirals of seashells.
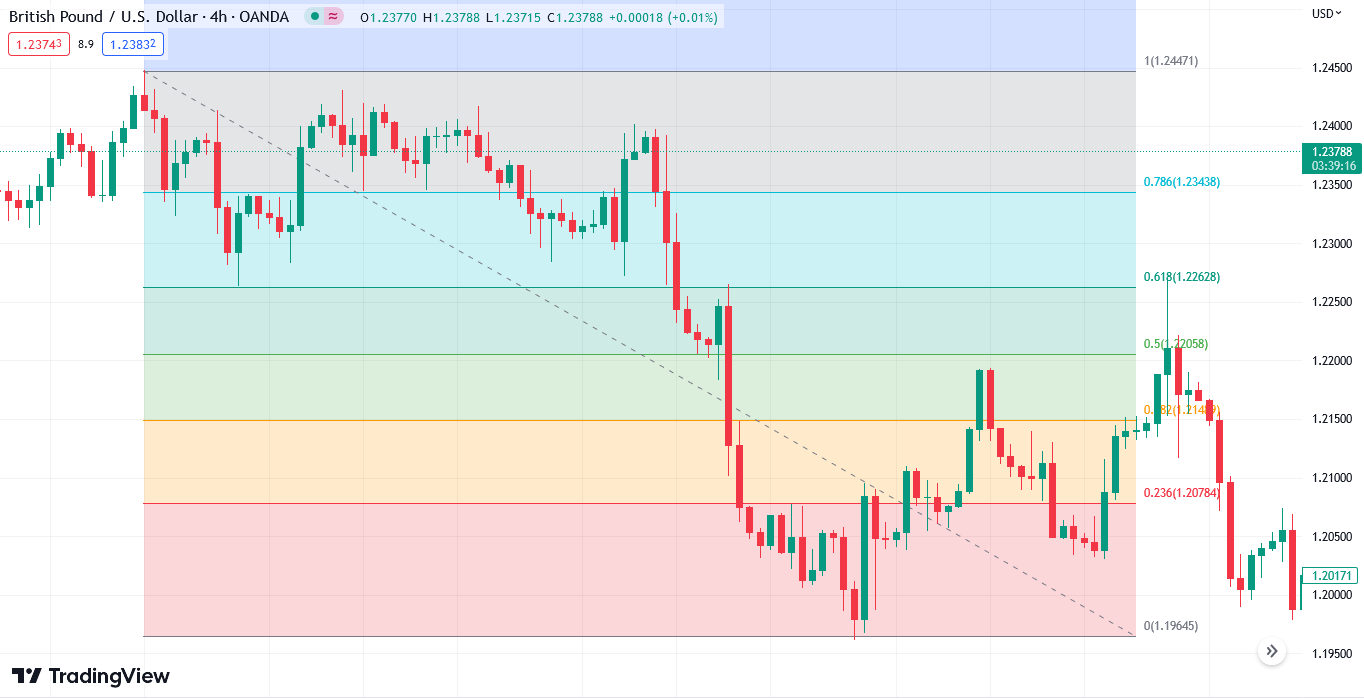
The Fibonacci retracement levels are calculated by drawing a trendline between two points on a chart and are based on the Fibonacci ratios: 23.6%, 38.2%, 50%, 61.8%, and 100%. We can expect a price reversal whenever the price hits these key ratios.
To use the tool, you first need to draw it properly. You start by drawing a trendline between two points on the chart, such as a recent low and a recent high. Most trading software like Mitrade Webtrader comes with an automatic Fibonacci tool, so you don't have to do it manually.
When drawing from a high point to a low point, you look to go short whenever the price touches the Fibonacci ratios. On the other hand, when drawing from the low to the high point, you go long when the price touches key ratios.
Fibonacci
8. Pivot Point
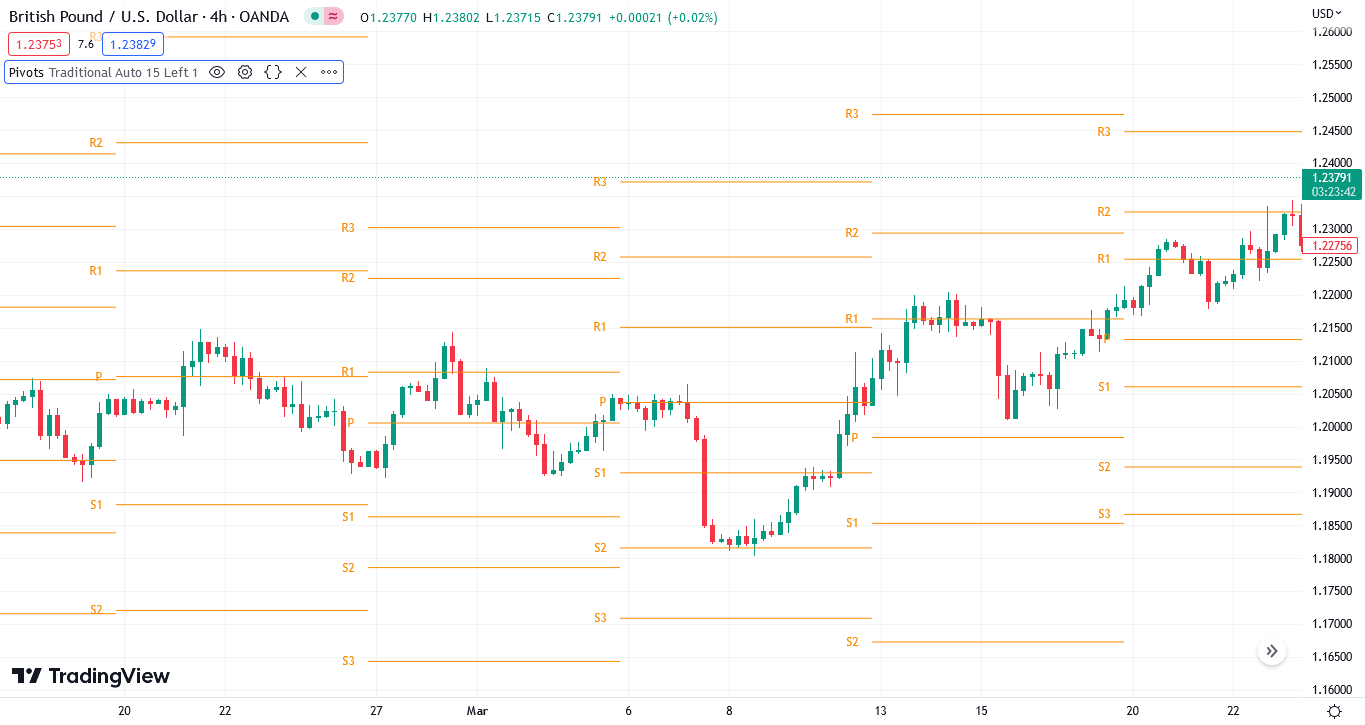
We have another tool on our list: Pivot points, which are used to identify areas of support and resistance. They're calculated using the previous day's high, low, and close prices and plotted on the chart as horizontal lines.
There are several types of pivot points, including:
Standard pivot point
Fibonacci pivot point
Woodie pivot point
Each type uses a slightly different calculation method, but they all identify key support and resistance levels.
The most common way to trade Pivot Points is to take positions when the price reaches a pivot level.
It’s important to note that Pivot Point comes as an indicator on many trading platforms, rather than a simple tool.
Pivot Points
9. Awesome Oscillator
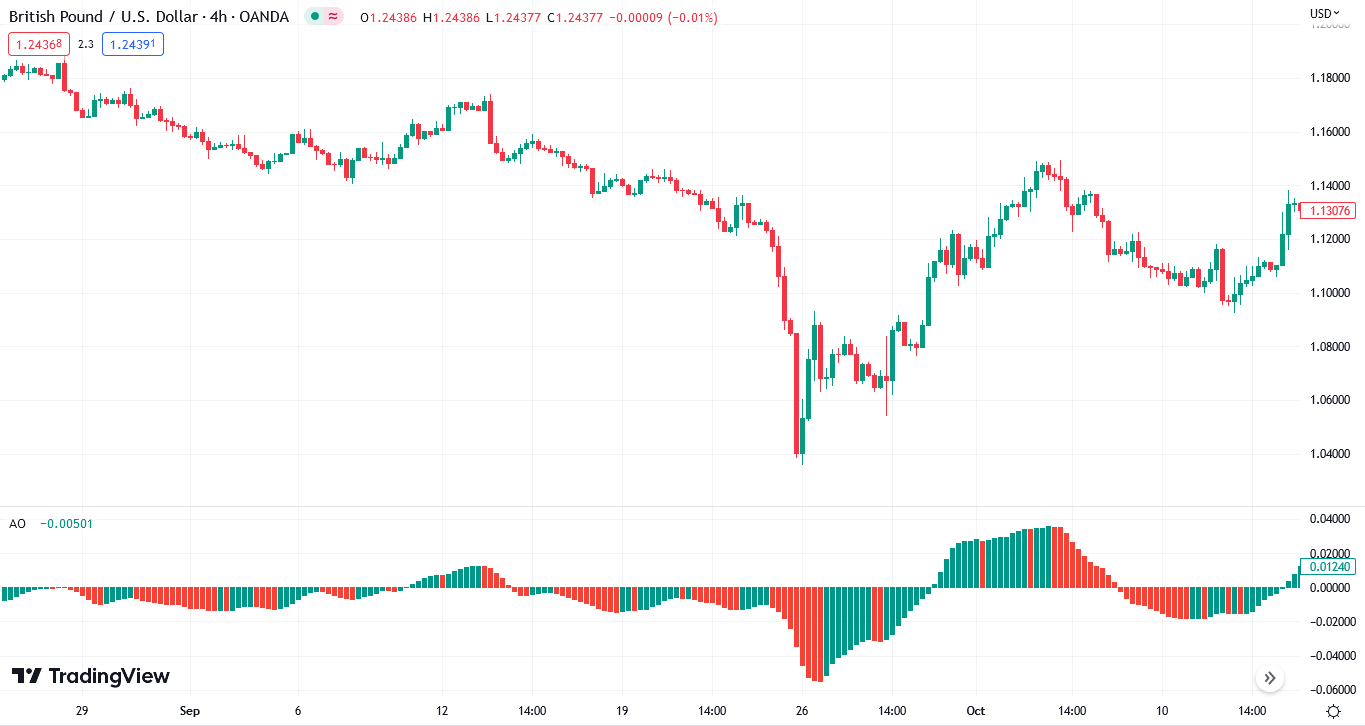
The Awesome Oscillator belongs to a family of oscillators and is used to indicate the trend’s momentum. It is calculated by taking the difference between two SMAs, resulting in a histogram on the chart.
The histogram oscillates above and below a zero line, creating green and red bars. When the histogram bars are green and above the zero line, this suggests bullish momentum. Conversely, if the bars are red and below the zero line, it indicates a bearish momentum.
You can also use the oscillator to look for divergences. If the price makes new highs, but AO doesn't, it signifies a potential reversal to bullish momentum. Conversely, if the price makes new lows, but the AO doesn't, it shows a potential reversal to bearish momentum.
Awesome Oscillator
10. MACD
So, we have reached the end of our list of the best forex technical indicators. What better way to end the list than with the super popular indicator among forex traders?
MACD, or, Moving Average Convergence Divergence, identifies trends and momentum.
It consists of a MACD line, a signal line, and a histogram.
When the MACD line crosses above the signal line, this is seen as a bullish signal. Conversely, when the MACD line crosses below the signal line, it's a sign of bullish momentum.
Like the Awesome Oscillator, MACD's histogram determines the market trend. When the histogram bars are green and above zero, it suggests bullish momentum. On the other hand, if the bars are red and below zero, it signifies bearish momentum.
Similar to other oscillators on our list, you can use MACD to identify divergences. A bearish divergence occurs if the price is making higher highs while the MACD is making lower highs. Contrarily, if the price is making lower lows, but the MACD is making higher lows, this is called bullish divergence.
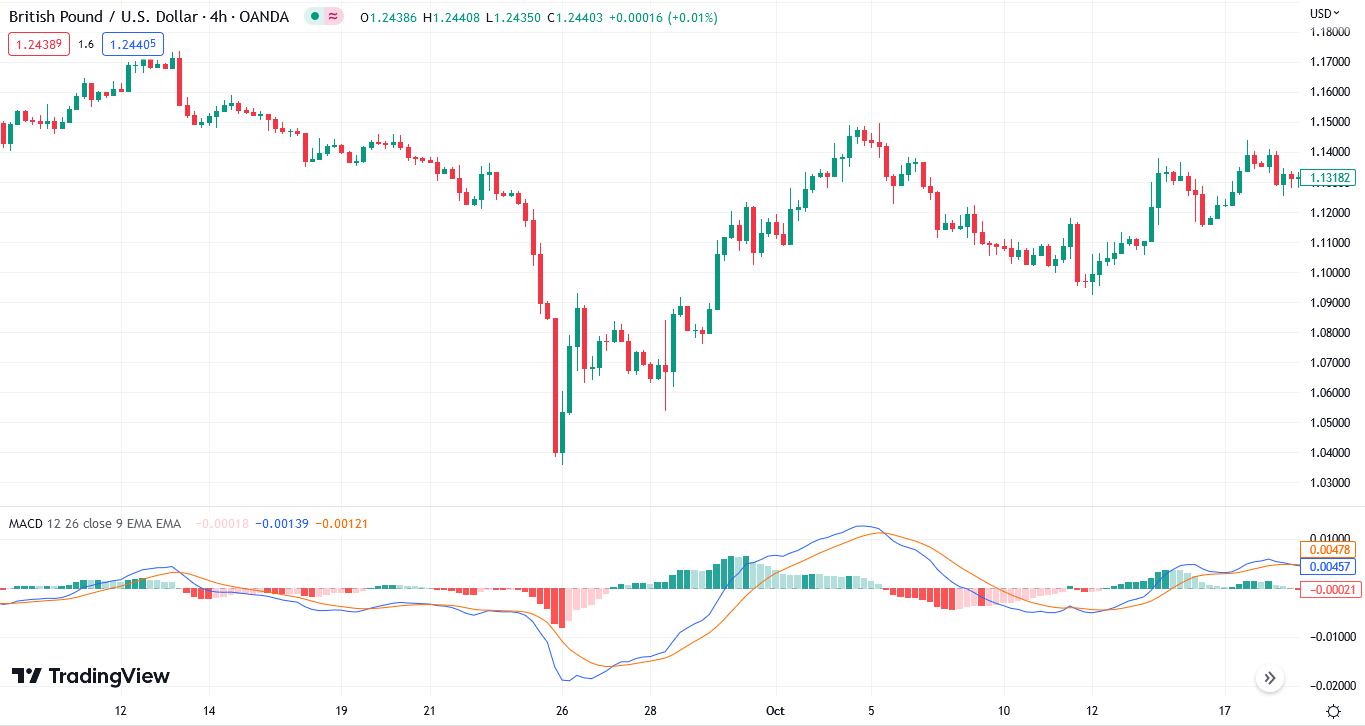
MACD
Summary of the indicators
Bottom line
So, there you have it! Many technical indicators are out there, but these 10 stand out from the herd.
It’s important to note that there isn’t a single indicator that is 100% accurate. If someone is telling you this, they are probably lying or have no idea about the forex indicators.
You don’t have to rely on a single indicator, you can use multiple indicators for signal confirmation and create a strategy.
If you are new to forex trading, we recommend trading on a demo account and using all the indicators and tools, and see which one is suitable for you.
Direct market access | Deal on rising and falling markets | 24-hour trading | Limit and stop loss for every trade

Before making any trading decisions, it is important to equip yourself with sufficient fundamental knowledge, have a comprehensive understanding of market trends, be aware of risks and hidden costs, carefully consider investment targets, level of experience, risk appetite, and seek professional advice if necessary.
Furthermore, the content of this article is solely the author's personal opinion and does not necessarily constitute investment advice. The content of this article is for reference purposes only, and readers should not use this article as a basis for any investment decisions.
Investors should not rely on this information as a substitute for independent judgment or make decisions solely based on this information. It does not constitute any trading activity and does not guarantee any profits in trading.
If you have any inquiries regarding the data, information, or content related to Mitrade in this article, please contact us via email: insights@mitrade.com. The Mitrade team will carefully review the content to continue improving the quality of the article.


