
US Dollar Index Price Forecast: Hovers near descending channel’s lower boundary at 100.50


The US Dollar Index may continue to weaken amid a sustained bearish trend, currently testing the descending channel’s lower boundary.
The 14-day RSI remains below 30, indicating the possibility of an imminent corrective rebound.
Immediate support is located at the psychological level of 100.00, followed by 99.76 — the lowest level recorded since April 2022.
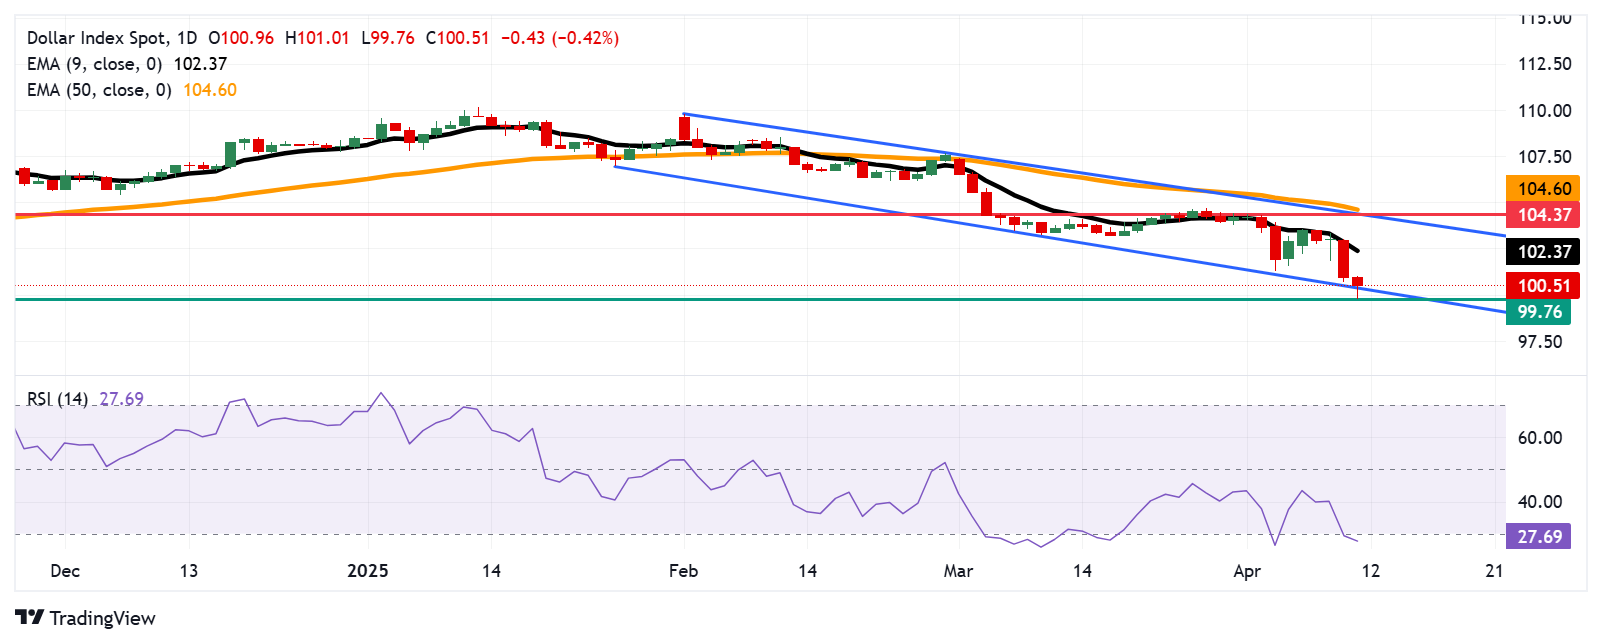
The US Dollar Index (DXY), which tracks the performance of the US Dollar (USD) against a basket of six major currencies, continues its decline for the second consecutive session, hovering around 100.40 during Friday’s Asian trading hours. The technical analysis of the daily chart suggests a sustained bearish trend, with the index testing the lower boundary of a prevailing descending channel.
Despite the downward pressure, the 14-day Relative Strength Index (RSI) remains below 30, signaling the potential for an imminent upward correction. Furthermore, the DXY is trading well below its nine-day Exponential Moving Average (EMA), indicating weak short-term momentum.
On the downside, immediate support is seen at the psychological level of 100.00, followed by 99.76 — the lowest level since April 2022. Additional support lies near the 99.00 mark.
To the upside, a move toward the nine-day EMA at 102.34 could be on the cards. A decisive break above this level may enhance short-term bullish momentum and pave the way for a test of the key resistance zone near the upper boundary of the descending channel at the monthly high of 104.37, followed by 104.59.
US Dollar Index: Daily Chart
* The content presented above, whether from a third party or not, is considered as general advice only. This article should not be construed as containing investment advice, investment recommendations, an offer of or solicitation for any transactions in financial instruments.


