


GBP/USD Price Forecast: Attempts to recover from 1.2600 as it enters oversold zone


GBP/USD rebounds from oversold zone amid potential bullish reversal.
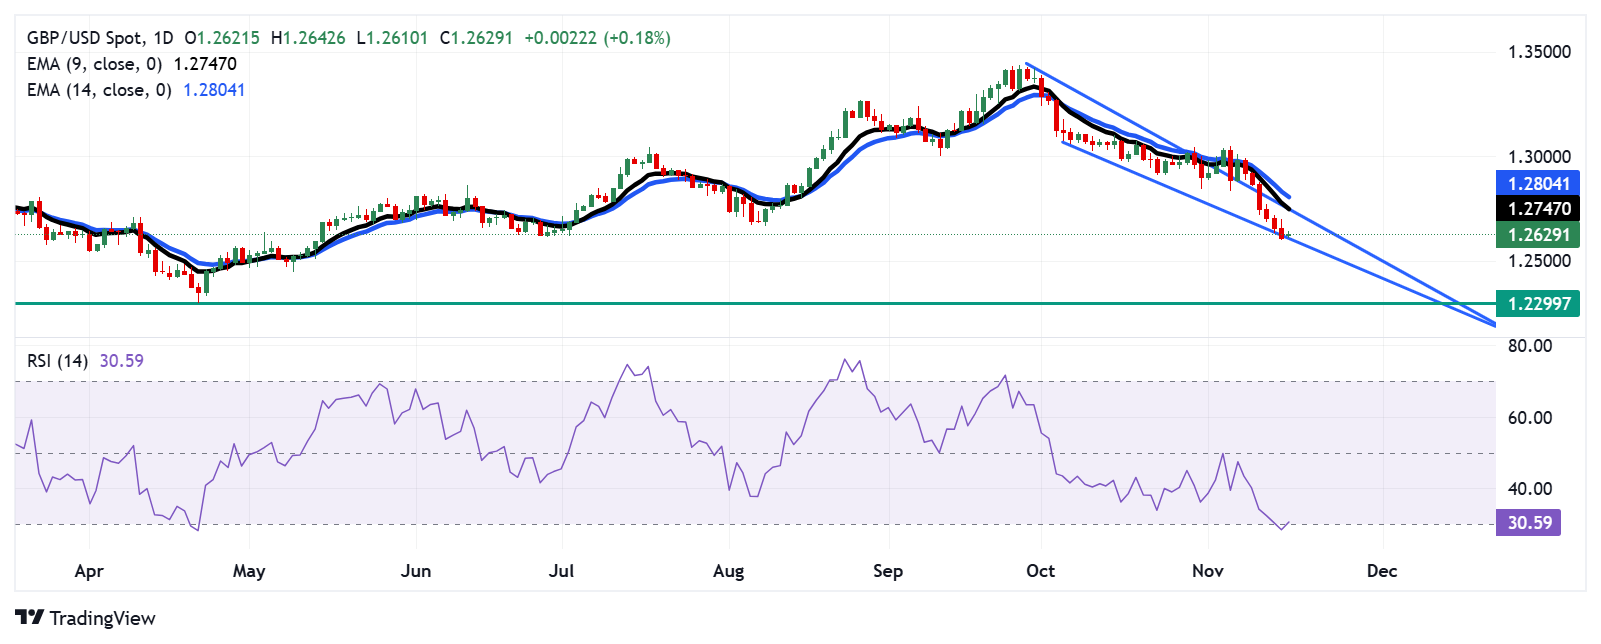
The lower boundary of the descending wedge at the psychological level of 1.2600 acts as the primary support.
The pair may approach the upper boundary of the descending wedge, aligned with the nine-day EMA at 1.2746 level.
GBP/USD breaks its six-day losing streak, trading around 1.2630 during the Asian hours on Monday. The daily chart analysis shows the sellers' control weakens as the pair moves downwards within the descending wedge pattern. This signals a potential bullish reversal for the pair.
Additionally, the 14-day Relative Strength Index (RSI) is at the 30 level, suggesting an oversold situation for the pair and a potential for an upward correction as soon as possible.
On the downside, the GBP/USD pair seems to test the lower boundary of the descending wedge at the psychological level of 1.2600. A break below this level would reinforce the bearish bias and put downward pressure on the pair to navigate the region around the yearly low at 1.2299, which was recorded on April 22.
For resistance, the GBP/USD pair could test the upper boundary of the descending wedge, aligned with the nine-day Exponential Moving Average (EMA) at 1.2746 level. Further barrier appears at the psychological level of 1.2800, aligned with the 14-day EMA at 1.2804 level.
GBP/USD: Daily Chart
Read more
* The content presented above, whether from a third party or not, is considered as general advice only. This article should not be construed as containing investment advice, investment recommendations, an offer of or solicitation for any transactions in financial instruments.


