


USD/CAD falls further to near 1.4250 amid strength in the Canadian Dollar.
Investors doubt that the BoC will continue reducing interest rates after the release of the hot CPI report for February.
The risk sentiment remains cautious as US President Trump is expected to announce significant tariffs on April 2.
The USD/CAD pair extends its downside move for the third day in a row on Wednesday and slides to near 1.4250. The Loonie pair weakens as the Canadian Dollar (CAD) traders higher against its peers, except antipodeans.
Canadian Dollar PRICE Today
The table below shows the percentage change of Canadian Dollar (CAD) against listed major currencies today. Canadian Dollar was the strongest against the British Pound.

The heat map shows percentage changes of major currencies against each other. The base currency is picked from the left column, while the quote currency is picked from the top row. For example, if you pick the Canadian Dollar from the left column and move along the horizontal line to the US Dollar, the percentage change displayed in the box will represent CAD (base)/USD (quote).
The CAD rises as investors hope that the Bank of Canada (BoC) could adopt a neutral monetary policy stance after remaining significantly dovish since June 2024. These expectations have stemmed from February’s Consumer Price Index (CPI) report, which showed that inflation accelerated at a faster-than-expected pace.
However, the faith of the Loonie is tied to United States (US) President Donald Trump’s tariff agenda. Trump is poised to announce a slew of tariffs for his trading partners on April 2.
Meanwhile, the US Dollar Index (DXY), which tracks the Greenback’s value against six major currencies, struggles to break above the immediate resistance of 104.50, which is the highest level in almost three weeks. Going forward, investors will focus on the US Personal Consumption Expenditure Price Index (PCE) data for February, which will be released on Friday. The inflation data will influence market expectations for the Federal Reserve’s (Fed) monetary policy outlook.
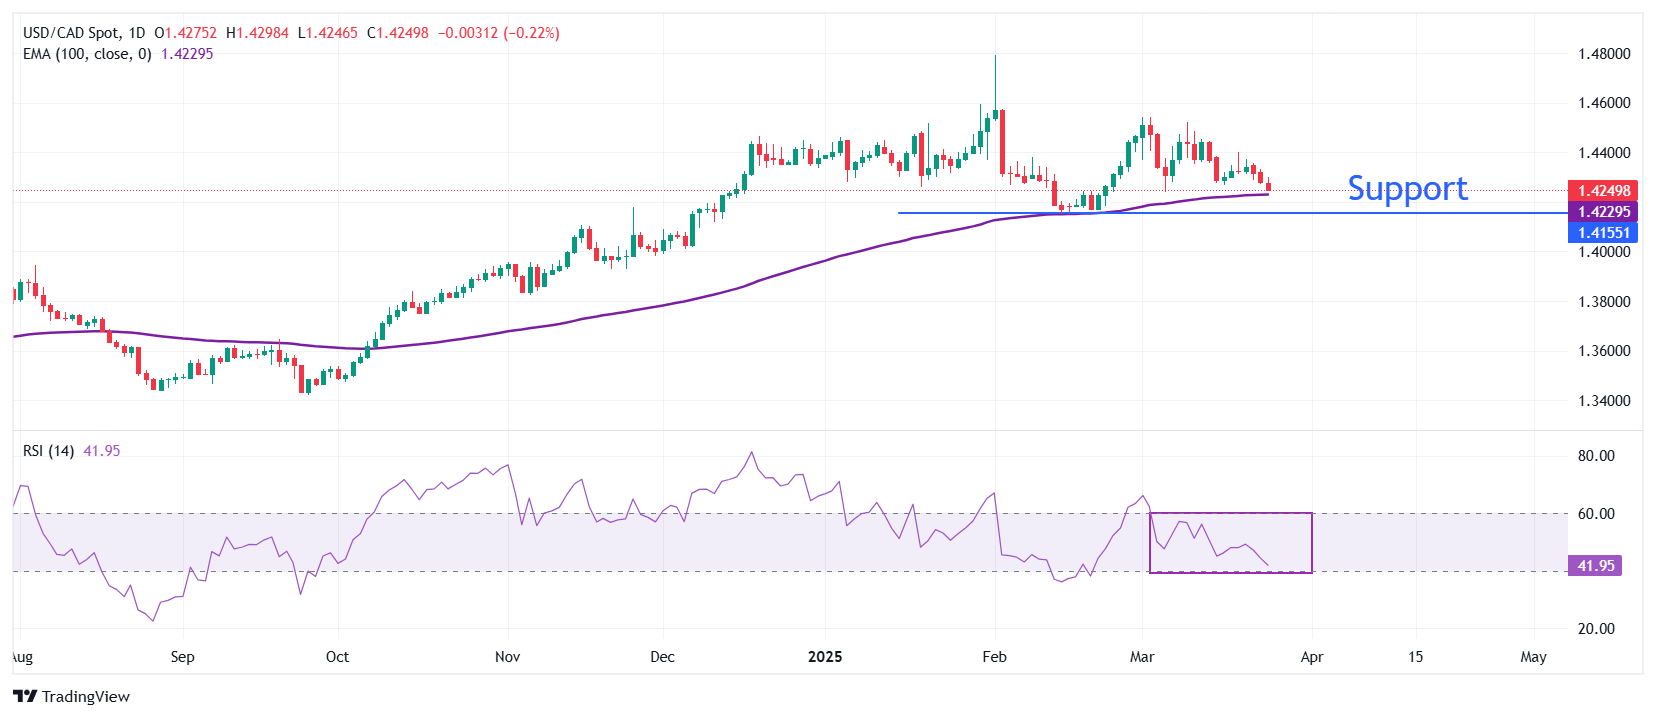
USD/CAD holds above the 100-period Exponential Moving Average (EMA), which is around 1.4226, suggesting that the overall trend is bullish.
The 14-period Relative Strength Index (RSI) oscillates in the 40.00-60.00 range, indicating a sideways trend.
Going forward, an upside move would emerge above the March 10 high of 1.4470, which will open the door toward the psychological resistance of 1.4500 and the January 30 high of 1.4595.
On the contrary, a breakdown below the February 14 low of 1.4151 by the pair would expose it to the December 9 low of 1.4094, followed by the December 6 low of 1.4020.
USD/CAD daily chart
* The content presented above, whether from a third party or not, is considered as general advice only. This article should not be construed as containing investment advice, investment recommendations, an offer of or solicitation for any transactions in financial instruments.


