


The US Dollar Index weakens to near 107.25 in Monday’s early European session.
The positive outlook of the DXY remains intact above the 100-day EMA, but further consolidation cannot be ruled out.
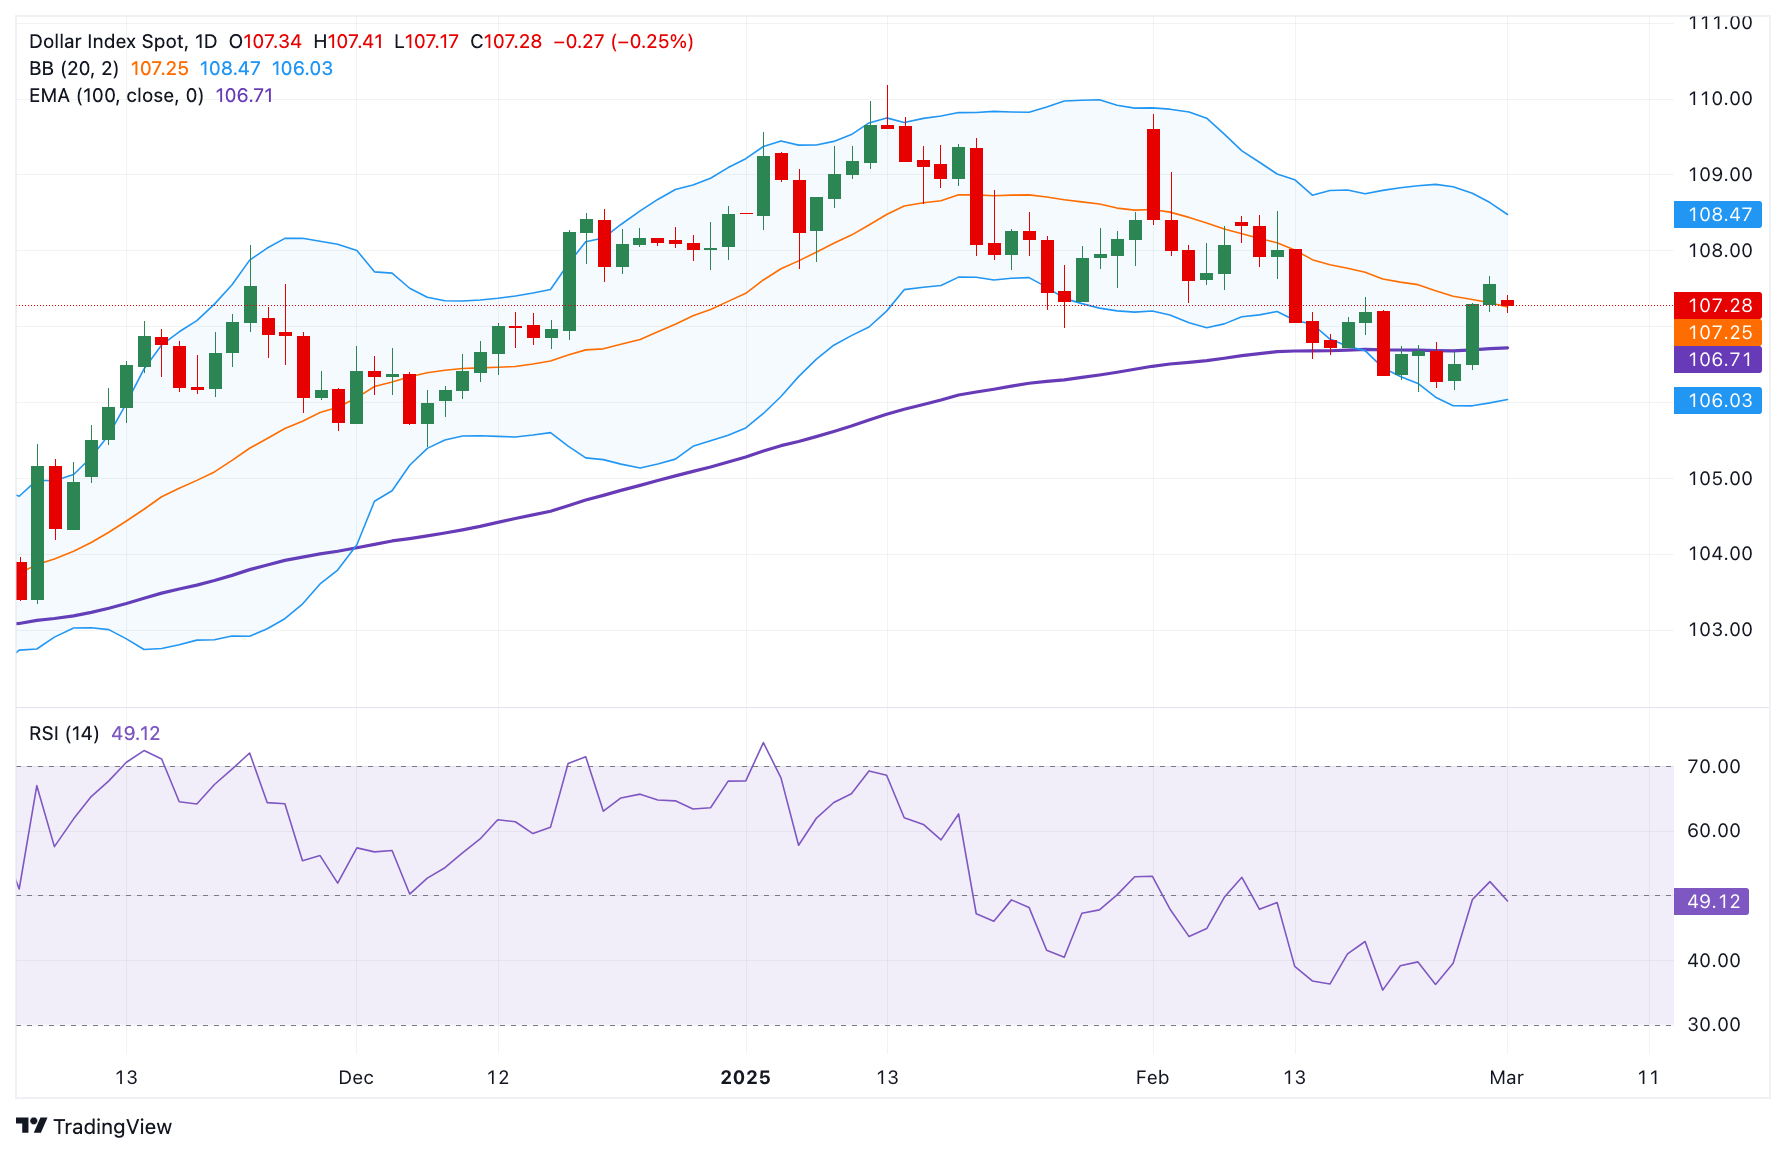
The immediate resistance level emerges at 108.45; the first support level is seen at 106.70.
The US Dollar Index (DXY) faces some selling pressure to near 107.25, snapping the three-day winning streak during the early European session on Monday. The rising expectation that the US Federal Reserve (Fed) will cut interest rates by a quarter of a percentage point twice by the end of this year drags the DXY lower.
Technically, the bullish outlook of the DXY remains in play as the index holds above the key 100-day Exponential Moving Average (EMA) on the daily chart. Nonetheless, the 14-day Exponential Moving Average (EMA) hovers around the midline, suggesting that further consolidation cannot be ruled out in the near term.
On the bright side, the immediate resistance level for the US Dollar Index emerges near 108.45, representing the high of February 10 and the upper boundary of the Bollinger Band. Sustained trading above this level could pave the way to 109.80, the high of February 3. The additional upside filter to watch is the 110.00 psychological level.
On the flip side, the 100-day EMA at 106.70 acts as an initial support level for the DXY. A decisive break below the mentioned level could expose the key contention level at 106.00, portraying the round figure and the lower limit of the Bollinger Band. Further south, the next downside stop to watch is 105.41, the low of December 6, 2024.
The US Dollar Index (DXY) daily chart
* The content presented above, whether from a third party or not, is considered as general advice only. This article should not be construed as containing investment advice, investment recommendations, an offer of or solicitation for any transactions in financial instruments.


