


US Dollar Price Forecast: Bearish outlook remains in play near 106.50

- Bitcoin Drops to $70,000. U.S. Government Refuses to Bail Out Market, End of Bull Market or Golden Pit?
- Gold rallies further beyond $5,050 amid flight to safety, dovish Fed expectations
- Bitcoin Bottom Debate: $70,000 or $50,000?
- A Crash After a Surge: Why Silver Lost 40% in a Week?
- Bitcoin Slips Below 75,000 Mark. Will Strategy Change Its Mind and Sell?
- Bitcoin Rout. Bridgewater Founder Dalio Publicly Backs Gold.
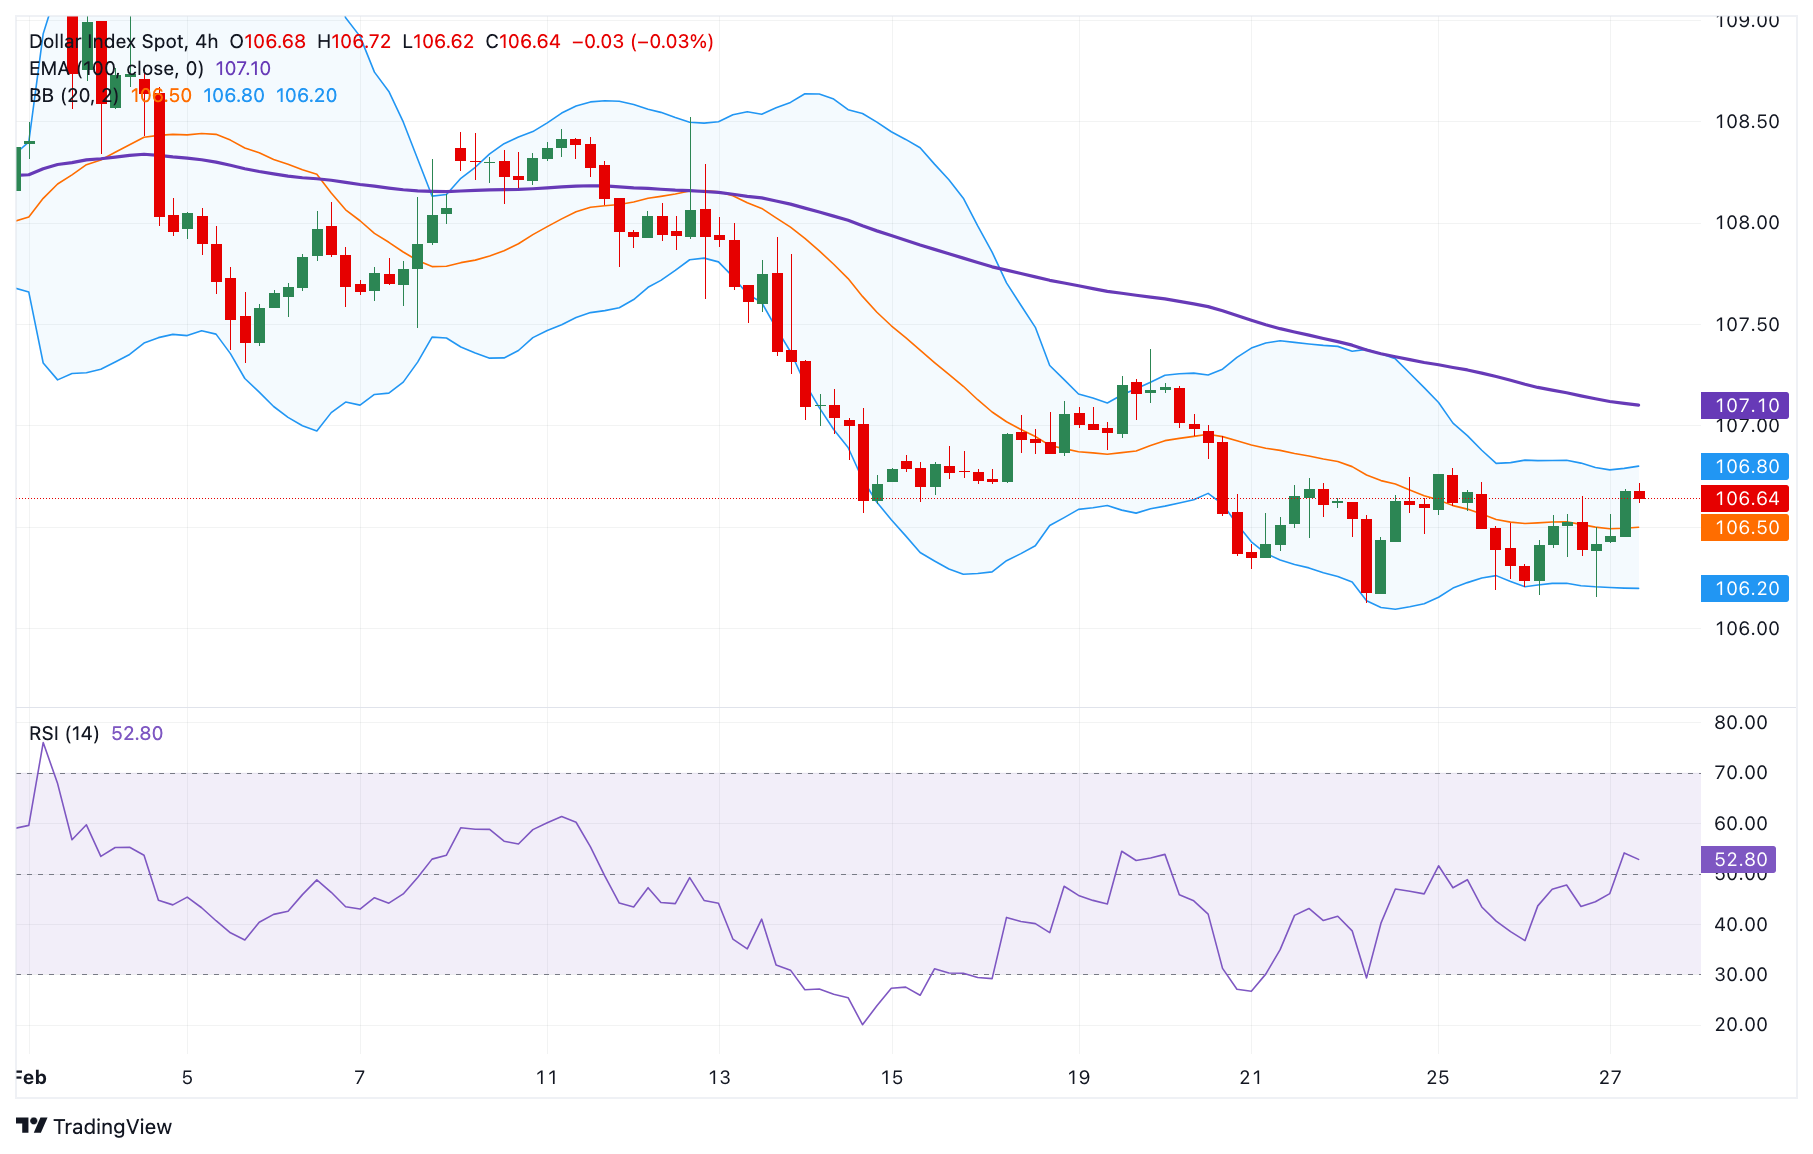
The US Dollar Index strengthens to near 106.65 in Thursday’s early European session.
The negative outlook of the DXY remains intact below the 100-day EMA, but further consolidation cannot be ruled out.
The first support level is seen at 106.20; the immediate resistance level emerges at 106.80.
The US Dollar Index (DXY) gains traction to near 106.65 during the early European session on Thursday. The cautious mood amid the tariff uncertainty from US President Donald Trump could lift the Greenback.
However, the weaker US economic data have prompted traders to raise bets for interest rate cuts, now seeing two quarter-point reductions this year, with the first likely in July and the next as early as October. This, in turn, might cap the upside for the DXY.
According to the 4-hour chart, the DXY keeps the bearish vibe as the price remains capped below the key 100-period EMA Exponential Moving Average (EMA). Nonetheless, further consolidation cannot be ruled out as the 14-day Relative Strength Index (RSI) crosses above the midline near 53.35.
The lower limit of the Bollinger Band at 106.20 acts as an initial support level for the index. A decisive break below the mentioned level could expose 105.80, the low of December 9. Extended losses could see a drop to 105.41, the low of December 6.
On the upside, the first upside barrier for the DXY emerges at 106.80, the upper boundary of the Bollinger Band. Sustained bullish momentum above this level could pave the way to the 107.00-107.10 region, the psychological level and the 100-EMA EMA. The next hurdle to watch is 107.38, the high of February 19.
US Dollar Index (DXY) 4-hour chart
Read more
* The content presented above, whether from a third party or not, is considered as general advice only. This article should not be construed as containing investment advice, investment recommendations, an offer of or solicitation for any transactions in financial instruments.


