


NZD/USD was seen trading around the 0.5825 zone ahead of the Asian session, extending its bullish momentum.
The pair surged past the 20-day SMA, though traders should monitor 0.5700, where a bearish crossover between the 20 and 100-day SMAs could develop.
Immediate resistance stands near 0.5850, while initial support lies around 0.5750, with a critical level at 0.5700.
NZD/USD continued its strong performance on Monday ahead of the Asian session, gaining traction and trading near the 0.5825 area. Bulls propelled the pair higher, breaching the 20-day Simple Moving Average (SMA) and reinforcing the bullish outlook. However, market participants should remain cautious as a potential bearish crossover between the 20 and 100-day SMAs around 0.5700 could threaten the rally.
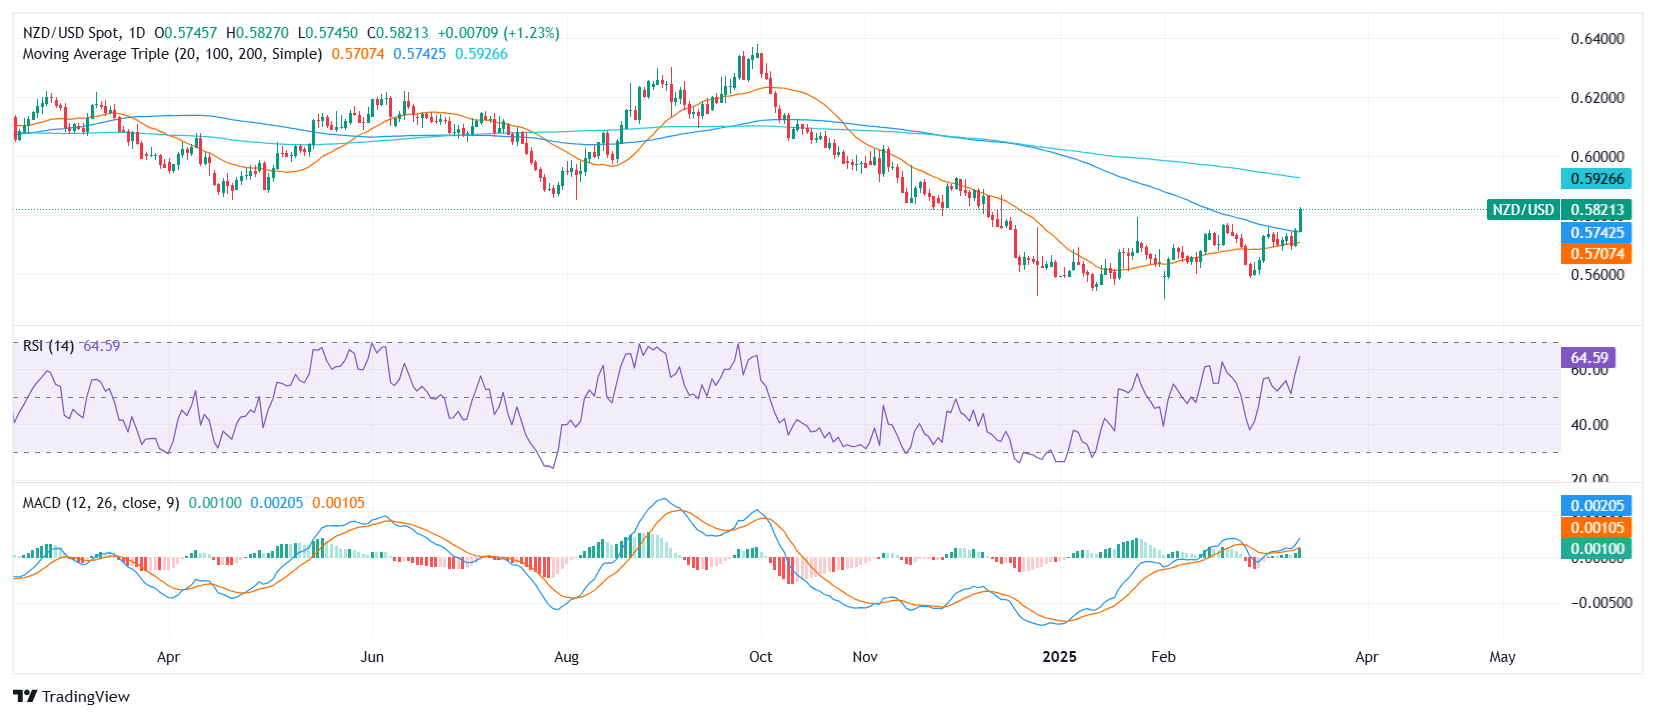
The Relative Strength Index (RSI) has risen sharply into near-overbought territory, currently hovering around 68, suggesting strong bullish momentum. Additionally, the Moving Average Convergence Divergence (MACD) is printing rising green bars, signaling increasing buyer strength. While the technical picture remains favorable for further gains, traders should watch for potential signs of exhaustion at current levels.
On the upside, immediate resistance is seen at 0.5850, with a breakout above this level opening the door to 0.5900. Meanwhile, initial support lies at 0.5750, followed by a crucial floor at 0.5700, where a bearish SMA crossover could add downward pressure. If the pair slips below this threshold, the outlook could shift in favor of the bears.
NZD/USD daily chart
* The content presented above, whether from a third party or not, is considered as general advice only. This article should not be construed as containing investment advice, investment recommendations, an offer of or solicitation for any transactions in financial instruments.


