

GBP/USD fell back below 1.2900 on Wednesday.
Markets are recoiling after Donald Trump renewed his tariff pledges.
An ever-growing list of tariffs is set to come into effect on April 2.
GBP/USD sewered on Wednesday, tumbling six-tenths of a percent top-to-bottom and pushed back below the 1.2900 handle as market sentiment recoils from a fresh batch of tariff threats from US President Donald Trump. Economic suddenly means very little as the Trump administration gears up to spark a them-vs-everybody trade war on April 2.
US President Donald Trump announces plan to tariff all imported cars 25%
Policymakers have warned that the Trump administration’s long-winded trade war aspirations are beginning to hurt the US's economic prospects. Red flags are also being raised by key financial agencies: according to the Standard & Poor’s (S&P) Global ratings contingent, there is a 25% probability of a US recession kicking off within the next year. S&P Global specifically highlighted that “US policy uncertainty poses risks to North American credit conditions”.
UK inflation figures came in broadly under market forecasts on Wednesday, helping to ease market concerns. The next batch of key UK data will be Friday’s final Q4 Gross Domestic Product (GDP) and Retail Sales updates. UK GDP growth is expected to match the previous figures during the fourth quarter of 2024, but Retail Sales figures are expected to contract slightly in February.
US GDP growth figures are also due on Thursday, but the non-preliminary print is unlikely to drive much momentum in either direction. This week’s key US data release will be Core Personal Consumption Expenditure Price Index (PCE) inflation due on Friday. Investors will be hoping that a recent upturn in inflation figures will prove to be temporary, but median forecasts are expecting annualized PCE inflation to rise to 2.7% YoY in February.
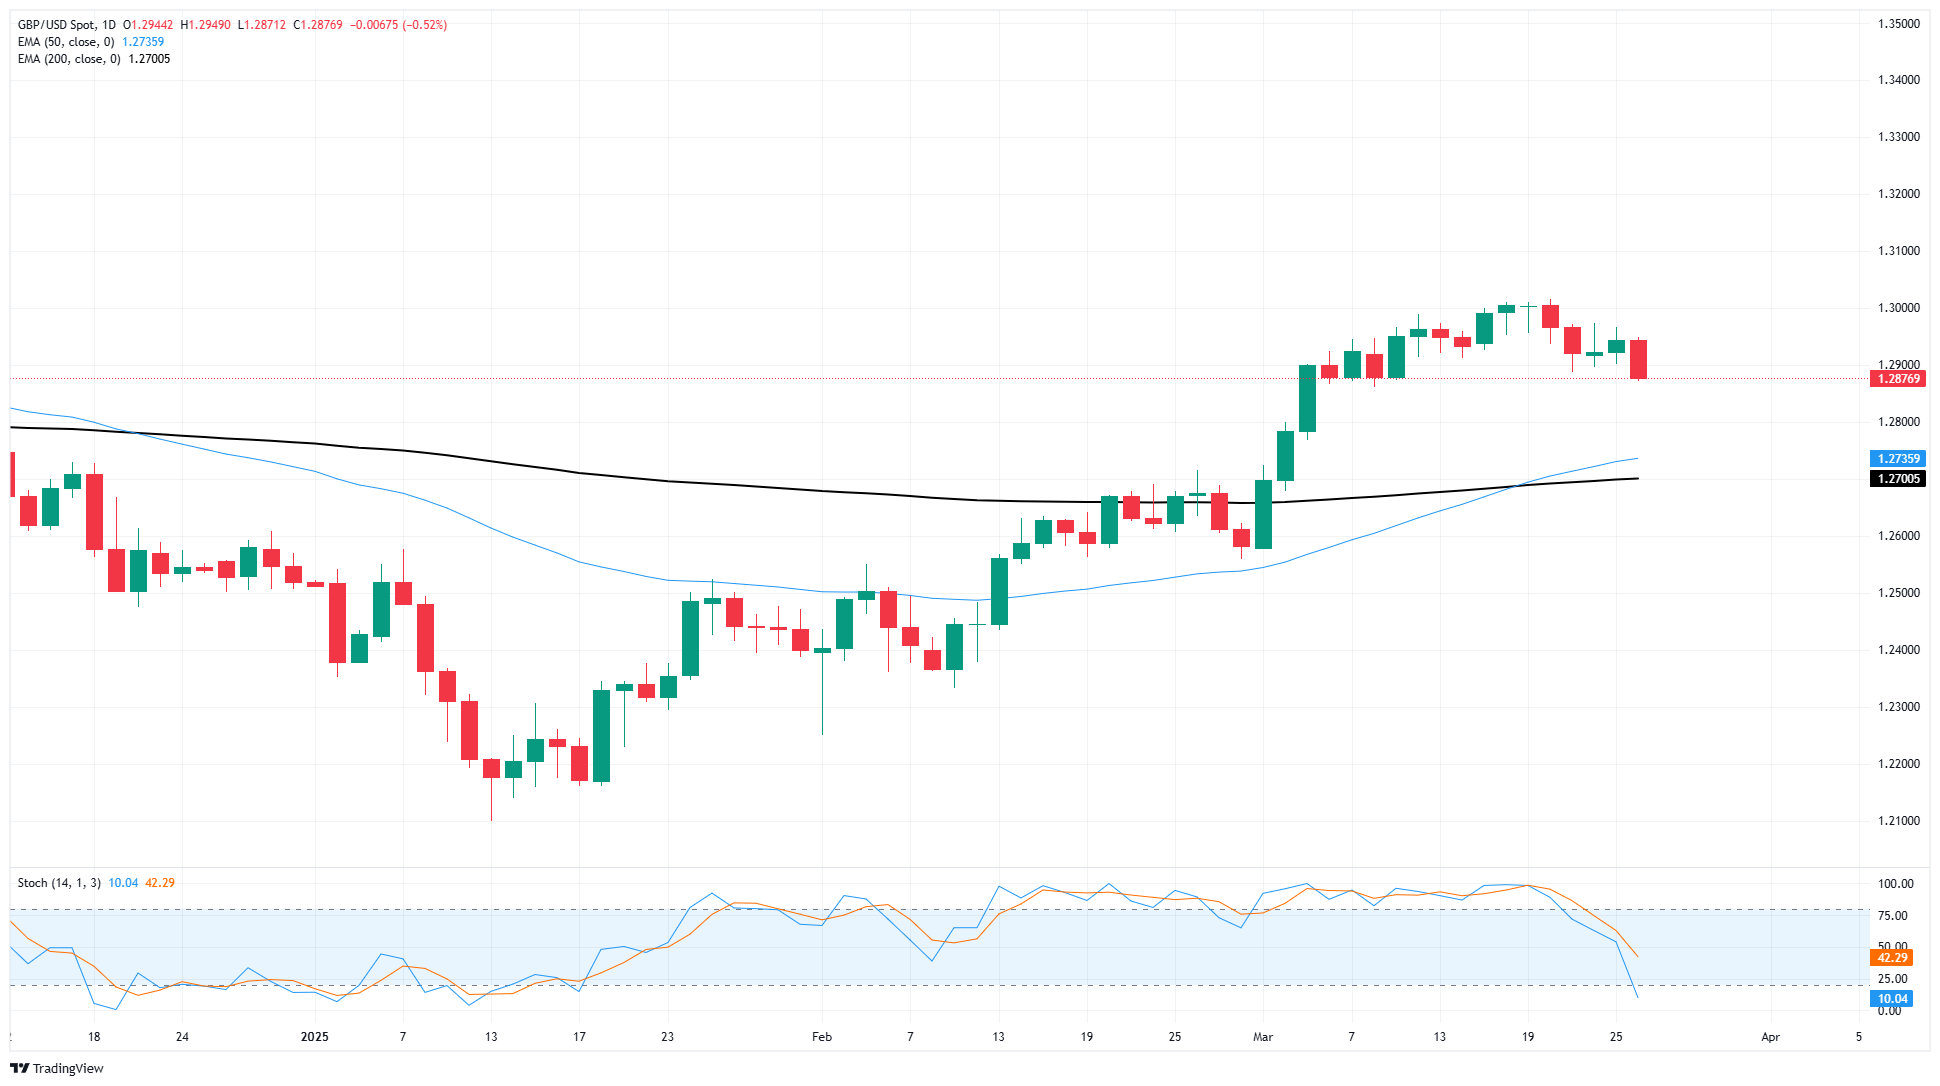
GBP/USD price forecast
GBP/USD chalked in another down day during the midweek market session, dragging bids down even further from the last swing high near 1.3000. Bearish pressure is beginning to accumulate, and price action could be poised for a downside snap as bidders lose the momentum war just north of the 200-day Exponential Moving Average (EMA) near 1.2725.
GBP/USD daily chart
* The content presented above, whether from a third party or not, is considered as general advice only. This article should not be construed as containing investment advice, investment recommendations, an offer of or solicitation for any transactions in financial instruments.


