


GBP/USD snaps winning streak as Cable markets take a breather

- Bitcoin Drops to $70,000. U.S. Government Refuses to Bail Out Market, End of Bull Market or Golden Pit?
- Gold rallies further beyond $5,050 amid flight to safety, dovish Fed expectations
- Bitcoin Bottom Debate: $70,000 or $50,000?
- A Crash After a Surge: Why Silver Lost 40% in a Week?
- Bitcoin Slips Below 75,000 Mark. Will Strategy Change Its Mind and Sell?
- Bitcoin Rout. Bridgewater Founder Dalio Publicly Backs Gold.
GBP/USD saw little movement compared to recent price action on Thursday.
Momentum is faltering after a sharp correction in rate cut expectations.
Investors are hunkering down ahead of key US NFP jobs data figures on Friday.
GBP/USD faltered on Thursday, ending a stellar three-day run that saw the Pound Sterling gain 2.57% bottom-to-top against the Greenback from the start of the week. A sharp readjustment to central bank rate cut expectations means Cable will see a far thinner interest rate differential than previously anticipated, prompting a harsh rebalancing in currency markets.
Forex Today: The US Nonfarm Payrolls are coming!
Rate markets are now pricing in fewer than 50 bps in rate cuts from the Bank of England (BoE) in 2025, a sharp drawdown in rate cut expectations as central banks continue to grapple with sticky inflation. Despite a general weakening in the UK’s domestic economy which would normally prompt a rate response from the BoE, still-high inflation metrics have tied policymakers’ hands.
US President Donald Trump delivered yet another pivot on his tariff plans, announcing a temporary reprieve on tariffs for all products included in the USMCA agreement that he personally negotiated during his first term. Despite the continued walkback from the Trump administration on its own tariff threats, markets were unable to find enough risk appetite to tilt markets back into the high side.
US Nonfarm Payrolls (NFP) will take on renewed significance on Friday as investors begin to watch economic data in earnest. Although the US economy is in an overall healthy place, cracks are beginning to show in the labor market. A Fresh round of inflation pressures, largely attributed to tariff concerns, is also hobbling growth expectations.
GBP/USD price forecast
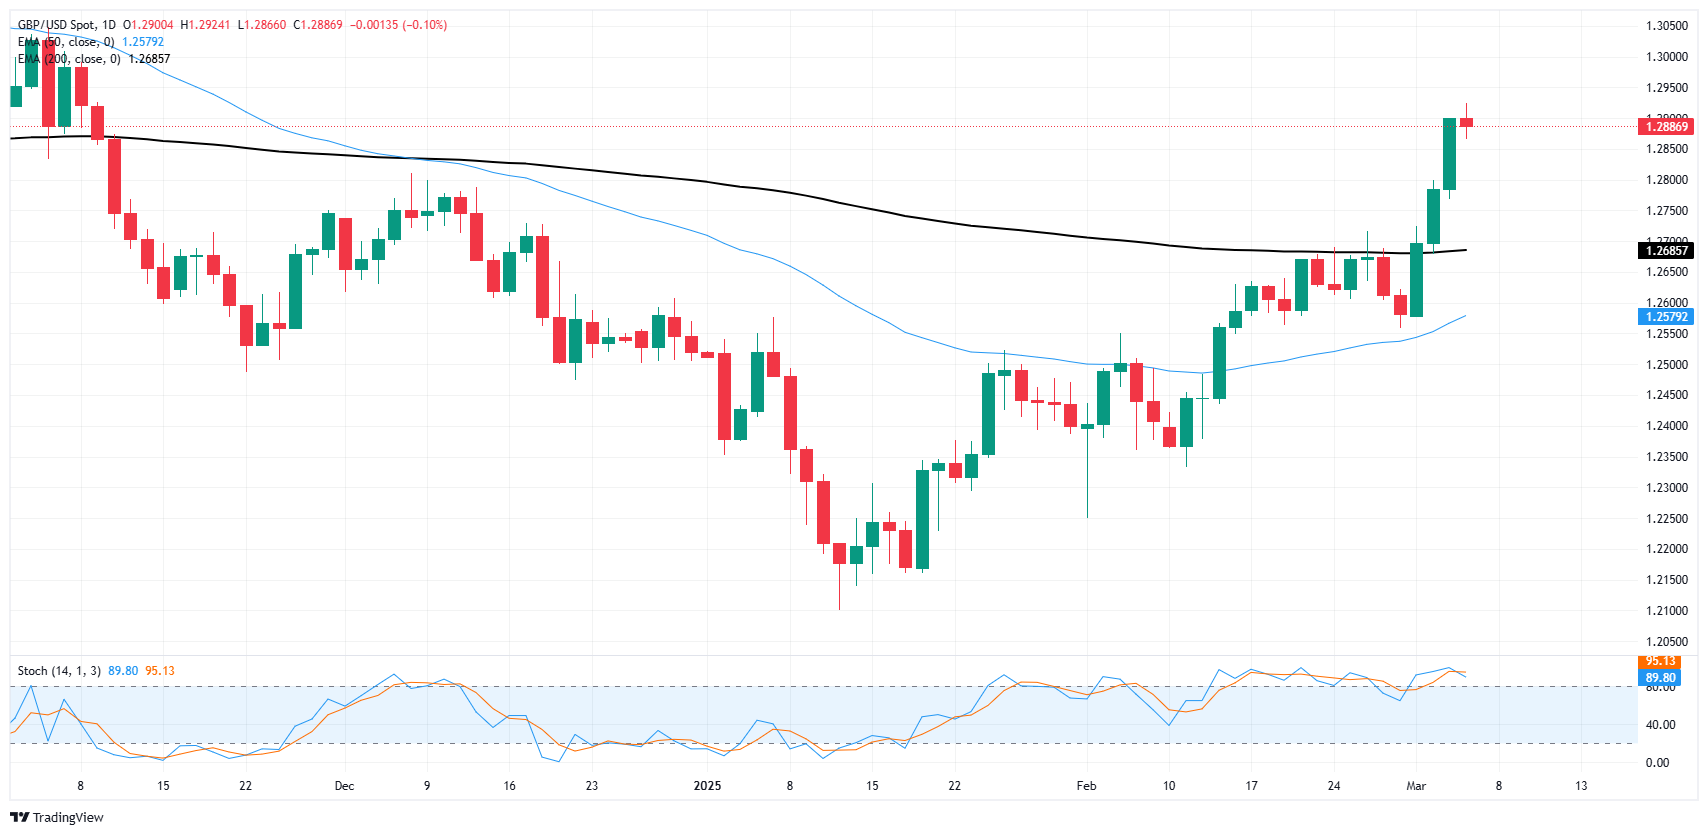
GBP/USD hit a speed bump at the 1.2900 handle, freezing the near-term bull run in its tracks and squeezing intraday bids into a tight consolidation candlestick. The Cable cleared the 200-day EMA near 1.2685 with ease, but bullish momentum is taking a breather.
Technical oscillators are still pinned in overbought territory, limiting bullish potential. However, an ongoing pattern of higher lows is baked into the chart as price action grinds higher from the technical bottom at 1.2100 in mid-January.
GBP/USD daily chart
Read more
* The content presented above, whether from a third party or not, is considered as general advice only. This article should not be construed as containing investment advice, investment recommendations, an offer of or solicitation for any transactions in financial instruments.


