


Australian Dollar edges lower as Trump expands steel and aluminum tariffs

- Bitcoin Drops to $70,000. U.S. Government Refuses to Bail Out Market, End of Bull Market or Golden Pit?
- Gold rallies further beyond $5,050 amid flight to safety, dovish Fed expectations
- Bitcoin Bottom Debate: $70,000 or $50,000?
- A Crash After a Surge: Why Silver Lost 40% in a Week?
- Bitcoin Slips Below 75,000 Mark. Will Strategy Change Its Mind and Sell?
- Bitcoin Rout. Bridgewater Founder Dalio Publicly Backs Gold.
The Australian Dollar depreciates as Trump imposes a 25% tariff on all steel and aluminum imports.
Australia’s Westpac Consumer Confidence rose 0.1% in February, reaching 92.2 in January from 92.1 prior.
The US Dollar appreciates amid the rising cautious mood surrounding the Fed’s policy outlook.
The Australian Dollar (AUD) weakened against the US Dollar (USD) on Tuesday as downward pressure mounted on the AUD/USD pair. The decline followed US President Donald Trump’s decision to expand steel and aluminum tariffs by 25% to include all imports, nullifying trade agreements with key US allies, including Australia. The White House confirmed that all import tax exclusions had been removed and indicated that further action on microchips and vehicles would be considered in the coming weeks.
Australia’s Westpac Consumer Confidence increased by 0.1% in February, reaching 92.2 from 92.1 in January. Despite the slight uptick, consumer confidence remained subdued due to ongoing concerns over household finances and the rising cost of living.
Market sentiment suggests growing expectations that the Reserve Bank of Australia (RBA) will lower its 4.35% cash rate at its next meeting in February. Traders now see a 95% probability of a cut to 4.10%, as recent data indicates that underlying inflation has eased more rapidly than the RBA anticipated. This has prompted several major Australian banks to shift their forecast for the first rate cut from May to February.
Australian Dollar declines amid rising cautious tone surrounding Fed’s policy outlook
The US Dollar Index (DXY), which measures the US Dollar’s value against six major currencies, rises above 108.00 at the time of writing. The Greenback receives support as the US Federal Reserve (Fed) is now expected to keep interest rates steady this year, following January’s jobs report released on Friday, which indicated slowing job growth but a lower Unemployment Rate.
US Nonfarm Payrolls (NFP) increased by 143,000 in January, significantly below December’s revised figure of 307,000 and the market expectation of 170,000. However, the Unemployment Rate declined slightly to 4% in January from 4.1% in December.
US Initial Jobless Claims rose to 219K for the week ending January 31, as reported by the US Department of Labor (DOL) on Thursday. This print surpasses initial estimates of 213K and was higher than the previous week's revised tally of 208K (from 207K).
Federal Reserve (Fed) Bank of Chicago President Austan Goolsbee mentioned on Friday that inconsistent policy approaches from the US government cause a high level of economic uncertainty that makes it difficult for the Fed to draw a bead on where the economy, and inflation specifically, are likely heading.
Meanwhile, Fed Board of Governors member Adriana Kugler noted that US growth and economic activity remain healthy overall, but noted that progress toward the Fed's inflation goals has been somewhat lopsided, per Reuters.
In an interview with CNBC, Minneapolis Fed President Neel Kashkari said that he would move towards supporting further rate cuts if they see good inflation data and the labor market stays strong
China’s Consumer Price Index (CPI) grew at an annual rate of 0.5% in January, up from 0.1% in December and exceeding the market forecast of 0.4%. On a monthly basis, CPI inflation rose 0.7% in January, compared to December’s flat reading of 0%, though it fell short of the expected 0.8% increase.
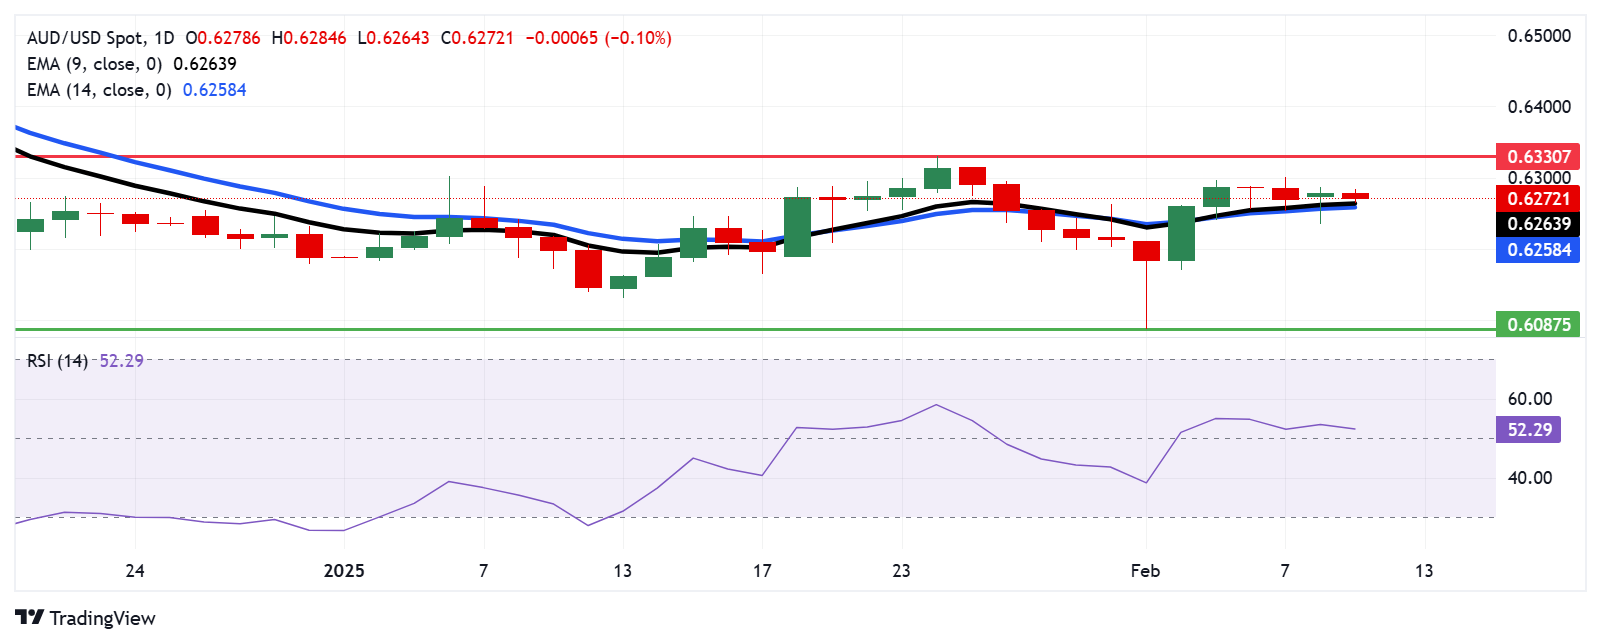
Technical Analysis: Australian Dollar tests nine-day EMA, followed by 0.6250
The AUD/USD pair hovers near 0.6270 on Tuesday, testing the nine- and 14-day Exponential Moving Averages (EMAs) on the daily chart. A break below these levels could weaken short-term price momentum. The 14-day Relative Strength Index (RSI) maintains its position above the 50 mark, suggesting a bullish bias is active.
On the upside, the AUD/USD pair may explore the region around the eight-week high of 0.6330, last reached on January 24.
The AUD/USD pair tests immediate support at the nine-day EMA of 0.6264 level, followed by the 14-day EMA of 0.6258. A decisive break below these levels could weaken the short-term price momentum, potentially pushing the pair toward 0.6087—the lowest level since April 2020, recorded on February 3.
AUD/USD: Daily Chart
Australian Dollar PRICE Today
The table below shows the percentage change of Australian Dollar (AUD) against listed major currencies today. Australian Dollar was the weakest against the Swiss Franc.
| USD | EUR | GBP | JPY | CAD | AUD | NZD | CHF | |
|---|---|---|---|---|---|---|---|---|
| USD | 0.05% | 0.05% | 0.02% | 0.17% | 0.10% | 0.06% | -0.01% | |
| EUR | -0.05% | -0.02% | -0.06% | 0.13% | 0.05% | 0.03% | -0.06% | |
| GBP | -0.05% | 0.02% | -0.02% | 0.13% | 0.05% | 0.03% | -0.06% | |
| JPY | -0.02% | 0.06% | 0.02% | 0.16% | 0.08% | 0.06% | -0.02% | |
| CAD | -0.17% | -0.13% | -0.13% | -0.16% | -0.07% | -0.09% | -0.19% | |
| AUD | -0.10% | -0.05% | -0.05% | -0.08% | 0.07% | -0.02% | -0.12% | |
| NZD | -0.06% | -0.03% | -0.03% | -0.06% | 0.09% | 0.02% | -0.09% | |
| CHF | 0.01% | 0.06% | 0.06% | 0.02% | 0.19% | 0.12% | 0.09% |
The heat map shows percentage changes of major currencies against each other. The base currency is picked from the left column, while the quote currency is picked from the top row. For example, if you pick the Australian Dollar from the left column and move along the horizontal line to the US Dollar, the percentage change displayed in the box will represent AUD (base)/USD (quote).
Read more
* The content presented above, whether from a third party or not, is considered as general advice only. This article should not be construed as containing investment advice, investment recommendations, an offer of or solicitation for any transactions in financial instruments.


