
EUR/USD caught in chart churn ahead of Wednesday’s HCOB PMIs, US ADP jobs figure


■EUR/USD remains trapped in constrained intraday cycle near 1.0750.
■Tuesday’s EU CPI inflation print warned of an uptick in EU inflation.
■Wednesday brings a packed docket with EU PMIs, PPIs, and US ADP jobs.
EUR/USD spent Tuesday in a churning pattern, cycling just below 1.075 as the pair grapples with finding momentum. Key labor data from the US looms ahead on Friday, and EU economic figures remain scattered throughout the back half of the trading week.
Pan-EU HCOB Core Harmonized Index of Consumer Prices (HICP) inflation held steady at 2.9% MoM in June, holding steady at the previous figure and snubbing the forecast decline to 2.8%. Overall YoY HICP inflation eased to 2.5% as forecast, ticking down from the previous 2.6%, but European inflation figures remain notably above the European Central Bank’s (ECB) 2% target band.
Forex Today: US data and FOMC should dictate the price action
Fedspeak from Federal Reserve (Fed) officials helped to bolster investor mood during Tuesday’s US market session, with key policymakers giving a firmer nod to recent improvements in US inflation data. US JOLTS Job Openings also rose slightly in May, climbing to 8.14 million from the forecast steady print at 7.91 million. Signs of extending slack within the US labor market are beginning to appear, giving rate-cut-hungry financial markets reason to hope that the Fed might get pushed towards a rate trim sooner rather than later.
Wednesday’s upcoming European market session will see final Producer Price Index (PPI) and HCOB Purchasing Managers Index (PMI) figures, while the US trading window features ISM Services PMI figure and the latest ADP Employment Change numbers, a rough preview of Friday’s upcoming US Nonfarm Payrolls (NFP) jobs data dump.
The pan-EU Composite PMI for June is expected to hold steady at 50.8, while May’s annualized European PPI is expected to improve, albeit slightly, to -4.1% YoY from the previous -5.7%.
US ADP Employment Change in June is forecast to rise slightly to 160K from the previous 152K. Meanwhile, June’s ISM Services PMI is expected to cool further to 52.5 MoM from the previous 53.8.
ECB President Christine Lagarde is expected to make an appearance near the end of the European market session, and he Federal Open Market Committee’s (FOMC) latest Meeting Minutes will be released later in the day.
Economic Indicator
ADP Employment Change
The ADP Employment Change is a gauge of employment in the private sector released by the largest payroll processor in the US, Automatic Data Processing Inc. It measures the change in the number of people privately employed in the US. Generally speaking, a rise in the indicator has positive implications for consumer spending and is stimulative of economic growth. So a high reading is traditionally seen as bullish for the US Dollar (USD), while a low reading is seen as bearish.
Next release: Wed Jul 03, 2024 12:15
Frequency: Monthly
Consensus: 160K
Previous: 152K
Source: ADP Research Institute
Traders often consider employment figures from ADP, America’s largest payrolls provider, report as the harbinger of the Bureau of Labor Statistics release on Nonfarm Payrolls (usually published two days later), because of the correlation between the two. The overlaying of both series is quite high, but on individual months, the discrepancy can be substantial. Another reason FX traders follow this report is the same as with the NFP – a persistent vigorous growth in employment figures increases inflationary pressures, and with it, the likelihood that the Fed will raise interest rates. Actual figures beating consensus tend to be USD bullish.
EUR/USD technical outlook
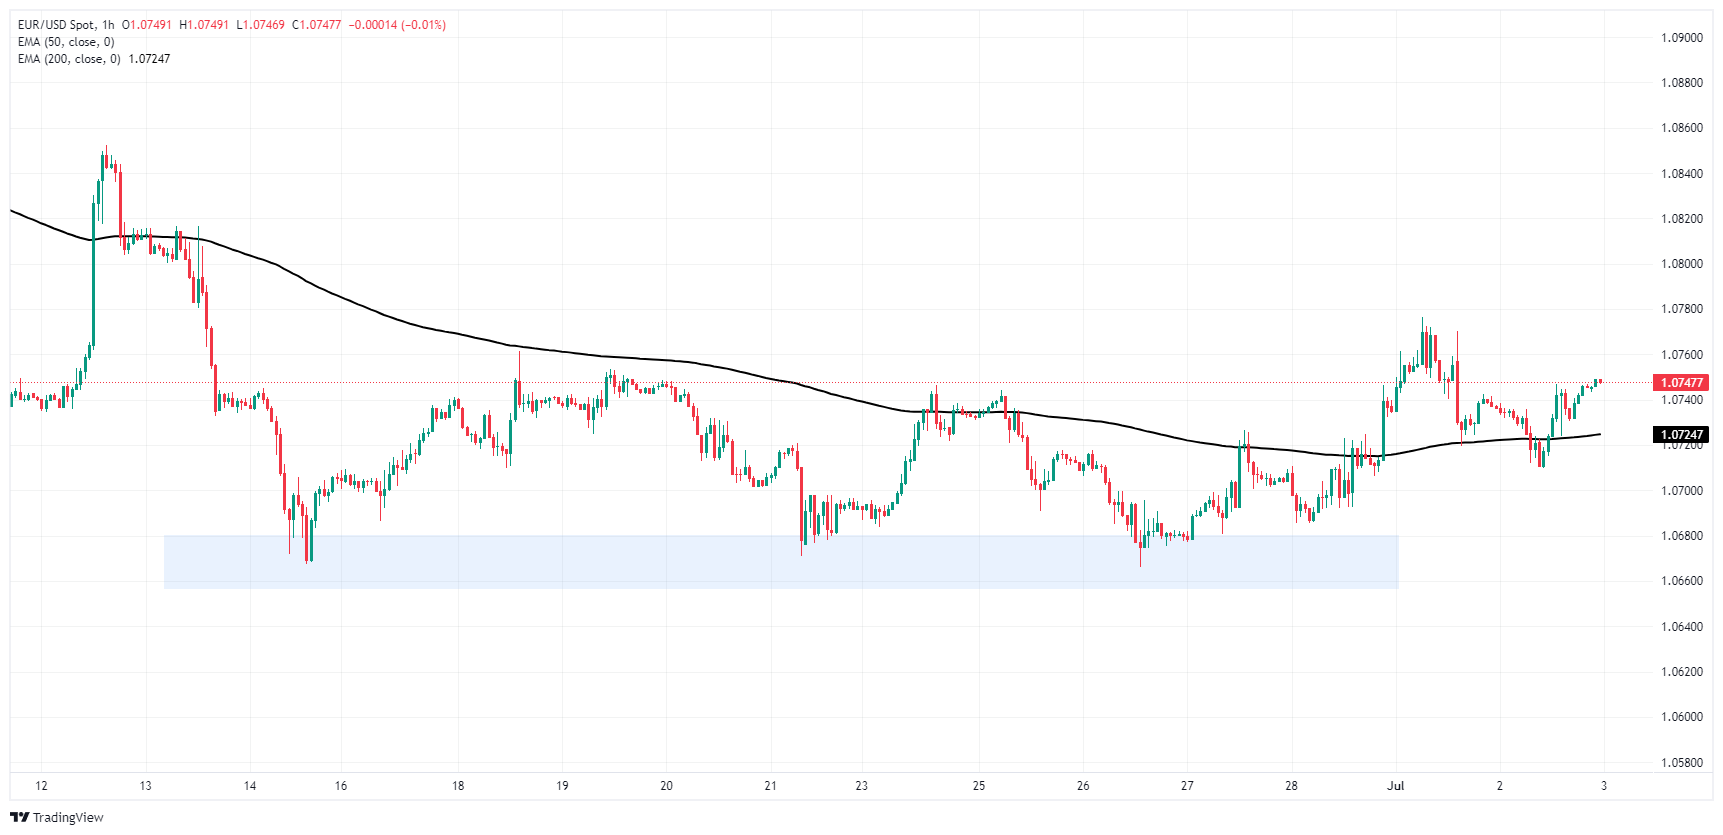
EUR/USD is extending a near-term consolidation pattern, drifting into the midrange as intraday price continues to get buoyed by a supply zone priced in below 1.0680. The Fiber is cycling median bids near the 200-hour Exponential Moving Average (EMA) near 1.0725.
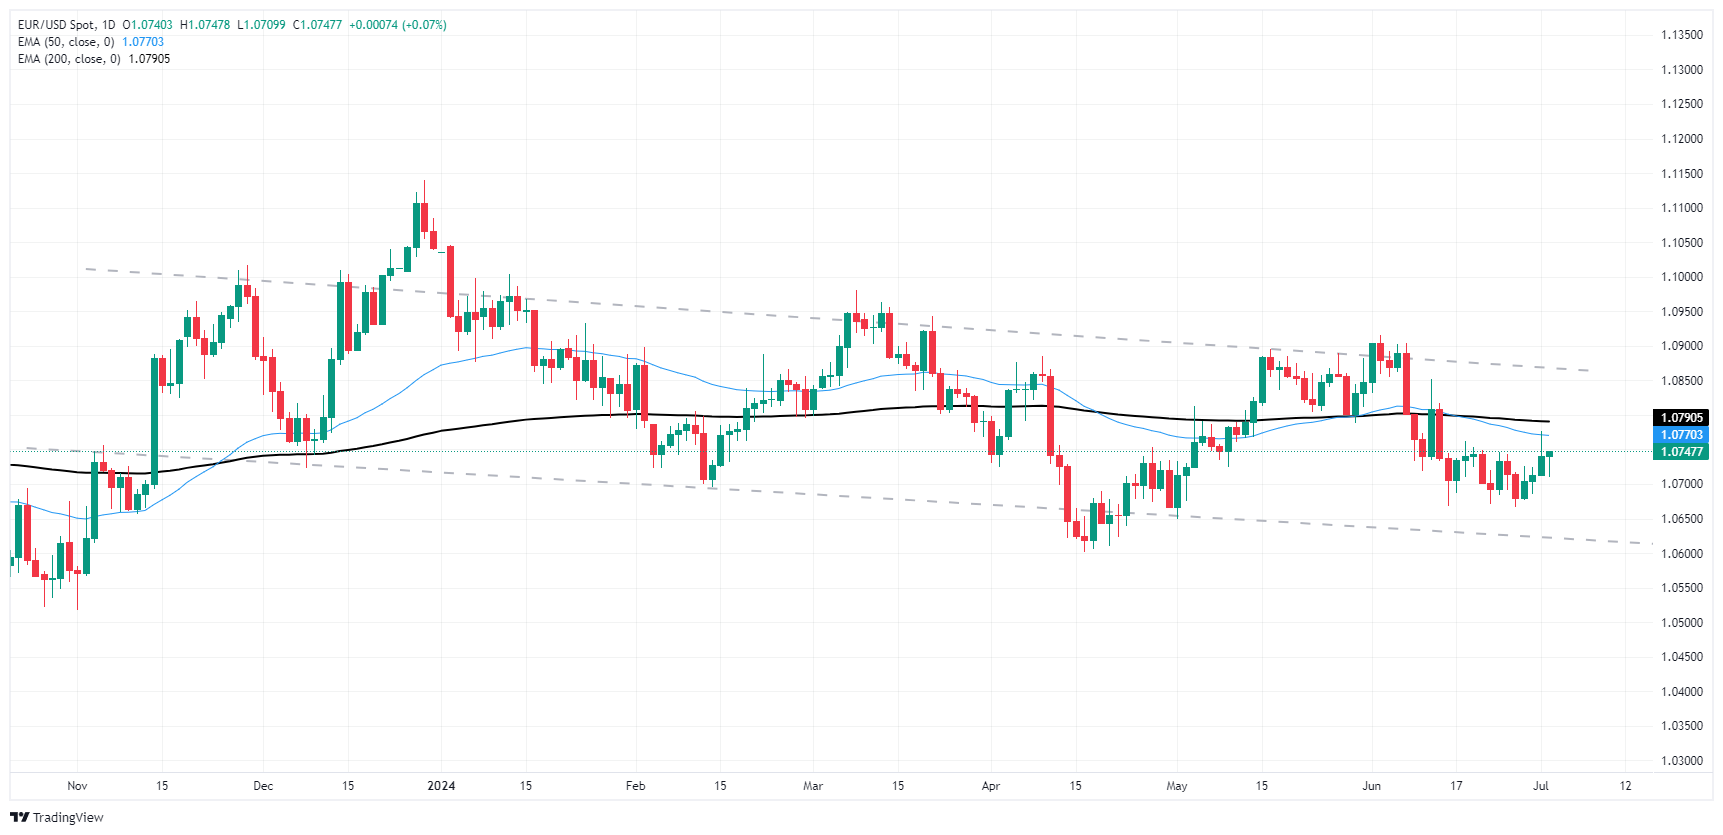
Daily candlesticks are poised for an upside breakout of recent consolidation, however technical resistance is priced in at the 50-day EMA near 1.0770 and a reversal of market flows will drag EUR/USD back down into the bottom end of a rough descending channel just above the 1.0600 handle.
EUR/USD hourly chart
EUR/USD daily chart
* The content presented above, whether from a third party or not, is considered as general advice only. This article should not be construed as containing investment advice, investment recommendations, an offer of or solicitation for any transactions in financial instruments.


