


■ EUR/USD may test the upper boundary as the daily chart analysis shows a bullish bias.
■ The 14-day RSI indicates a confirmation of a bullish trend for the pair.
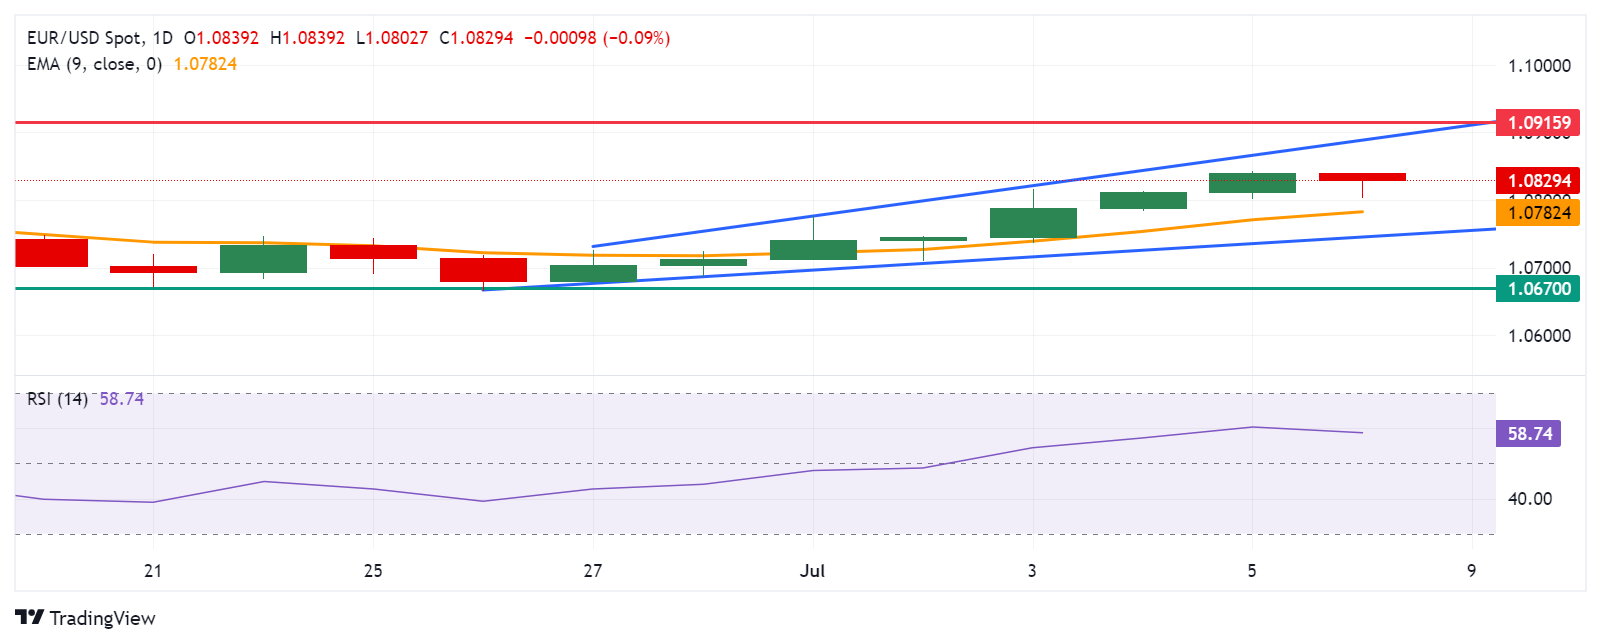
■ The nine-day EMA at the 1.0782 level could act as a key support.
EUR/USD halts its seven-day winning streak, trading around 1.0830 during the Asian hours on Monday. The renewed demand for the US Dollar (USD) puts pressure on the EUR/USD pair. However, the decline in the US Treasury yields could limit the upside of the Greenback and put pressure on the pair.
The technical analysis of the daily chart shows a bullish inclination, with the pair moving within an ascending channel. Furthermore, the 14-day Relative Strength Index (RSI), a momentum indicator, is above the 50 level, confirming the bullish trend for EUR/USD. Continued upward movement could reinforce the pair's bullish bias.
The EUR/USD pair faces potential resistance near the upper boundary of the ascending channel around 1.0890, with further resistance at the psychological level of 1.0900. A breakout above 1.0900 could strengthen the pair's momentum toward revisiting the three-month high at 1.0915.
On the downside, initial support for EUR/USD lies near the nine-day Exponential Moving Average (EMA) at 1.0782, followed by support near the lower boundary of the ascending channel around 1.0750.
A breach below the latter might increase downward pressure, targeting support around the key level of 1.0670, potentially serving as a rebound support level.
EUR/USD: Daily Chart
* The content presented above, whether from a third party or not, is considered as general advice only. This article should not be construed as containing investment advice, investment recommendations, an offer of or solicitation for any transactions in financial instruments.


