

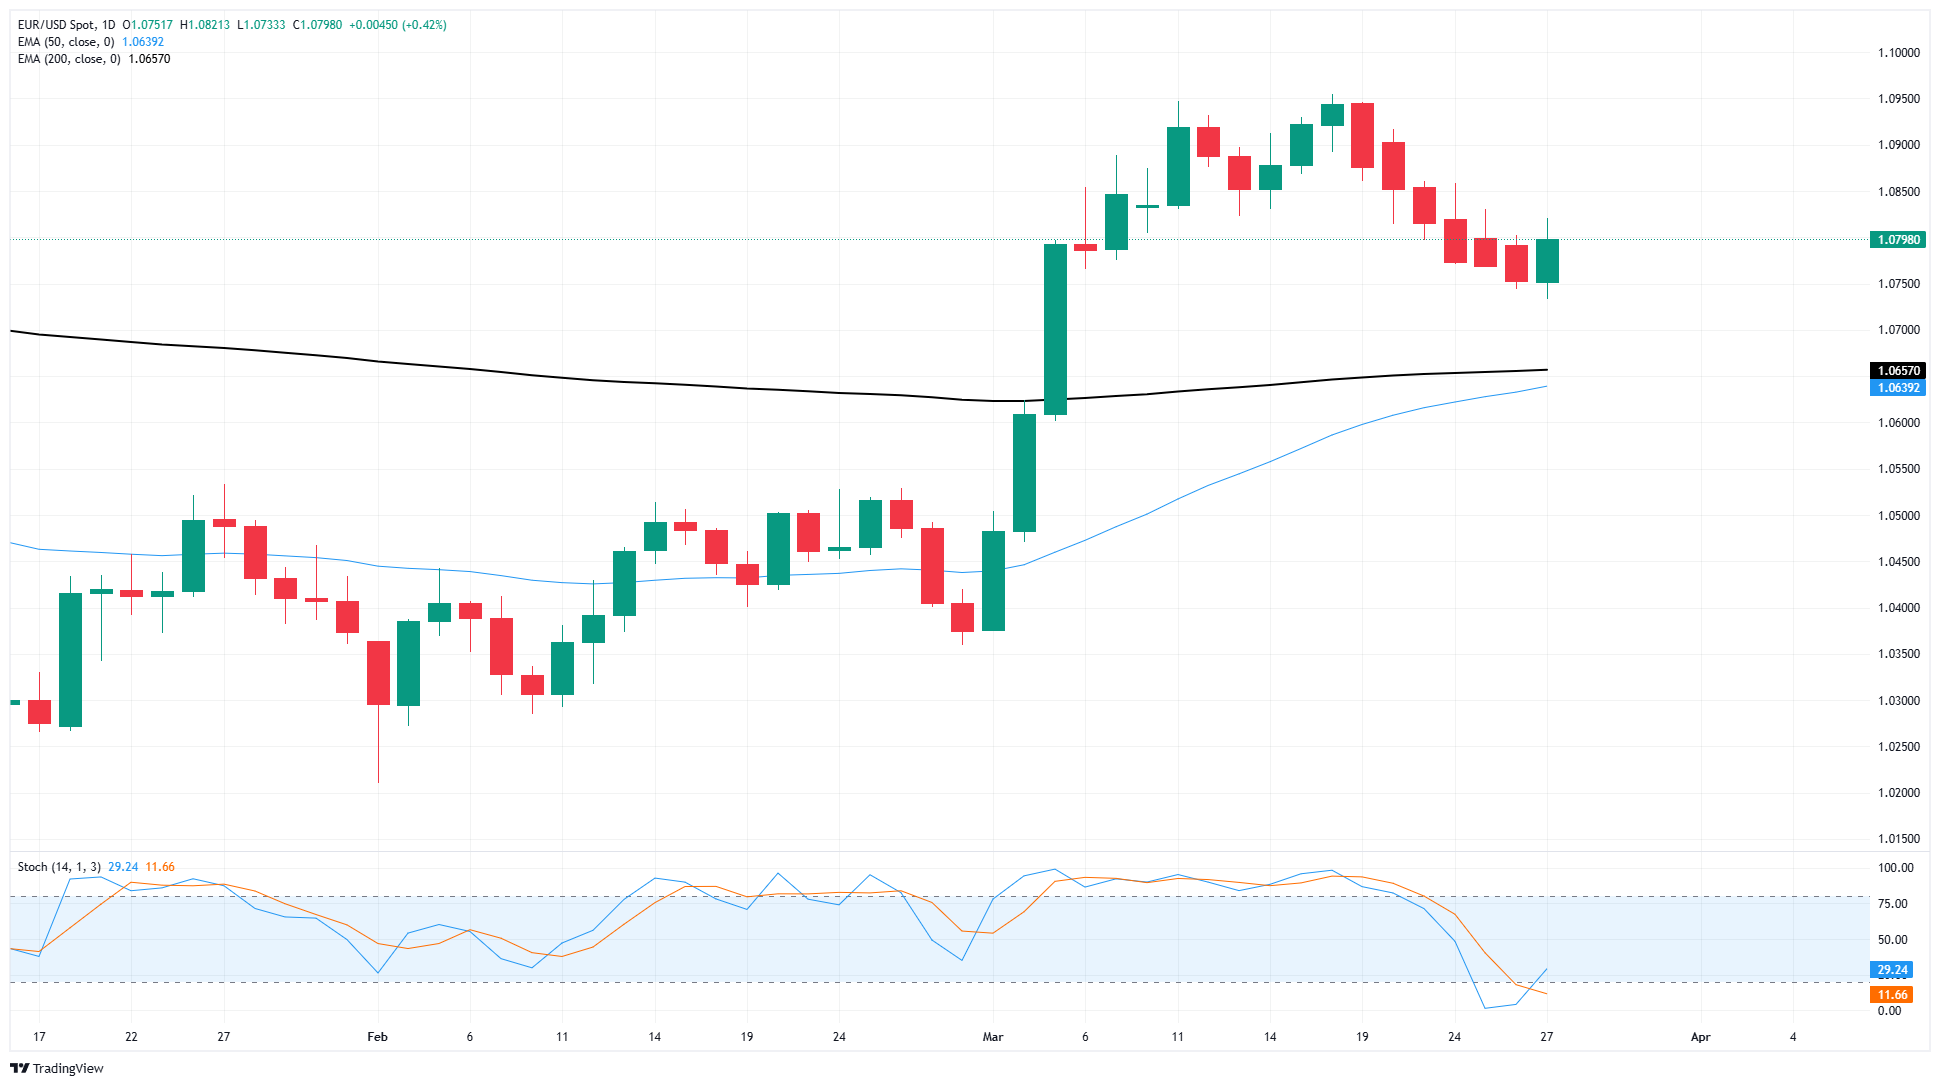
EUR/USD rose 0.4% on Thursday, snapping a six-day losing streak.
Fiber has drawn dangerously close to the 200-day EMA, signaling a potential reversal.
Key US inflation data looms ahead, just before tariffs are due to kick in.
EUR/USD caught a breather on Thursday, rising by four-tenths of one percent and snapping a six-day losing streak that saw Fiber shed 2% peak-to-trough. Tariff concerns continue to bubble away close to the center of investors’ attention spans, but Thursday saw some brief relief after US President Donald Trump focused elsewhere for the day, rather than ramping up a fresh batch of tariff proclamations via social media.
US GDP for Q4 2024 grew by 2.4%, surpassing expectations of 2.3%. However, Moody’s warned that higher tariffs and tax cuts may significantly increase government deficits and potentially downgrade US debt ratings, leading to higher Treasury yields.
S&P Global cautioned that US policy uncertainty could hinder global growth, while Fitch Ratings indicated that current tariffs might severely impact smaller economies like Brazil, India, and Vietnam, complicating their ability to purchase US goods. The CBO reduced its 2025 GDP forecast to 1.9%, predicting that this growth rate will persist through 2035, with inflation slowing to a near halt by 2025. They also foresee the budget deficit rising to 7.3% of GDP in 2025 without policy adjustments and that interest payments could consume 5.4% of GDP by 2055.
This week’s key US data release will be Core Personal Consumption Expenditure Price Index (PCE) inflation due on Friday. Investors will be hoping that a recent upturn in inflation figures will prove to be temporary, but median forecasts are expecting annualized PCE inflation to rise to 2.7% YoY in February.

EUR/USD price forecast
With Fiber’s near-term losing streak broken, EUR/USD bidders will be looking to push prices back above the current target at the 1.0900 handle. Fiber lost its foothold on the key technical level, but buyers managed to stop the bleed, at least for now.
Price action is still churning chart paper just north of the 200-day Exponential Moving Average (EMA) near 1.0700. If technical support breaks and selling pressure begins to dominate, it’s a long fall to the last swing low near 1.0350.
EUR/USD daily chart
* The content presented above, whether from a third party or not, is considered as general advice only. This article should not be construed as containing investment advice, investment recommendations, an offer of or solicitation for any transactions in financial instruments.


