
EUR/USD Price Forecast: Retakes 1.0800 mark; seems vulnerable while below 23.6% Fibo.


EUR/USD stages a modest recovery from over a two-week low touched the previous day.
The technical setup seems tilted in favor of bears and supports prospects for deeper losses.
A sustained move beyond the overnight swing high is needed to negate the negative bias.
The EUR/USD pair attracts some buyers during the Asian session on Tuesday and for now, seems to have snapped a four-day losing streak to over a two-week low, around the 1.0770 area touched the previous day. Spot prices reclaim the 1.0800 mark amid subdued US Dollar (USD) price action, though the uptick lacks bullish conviction.
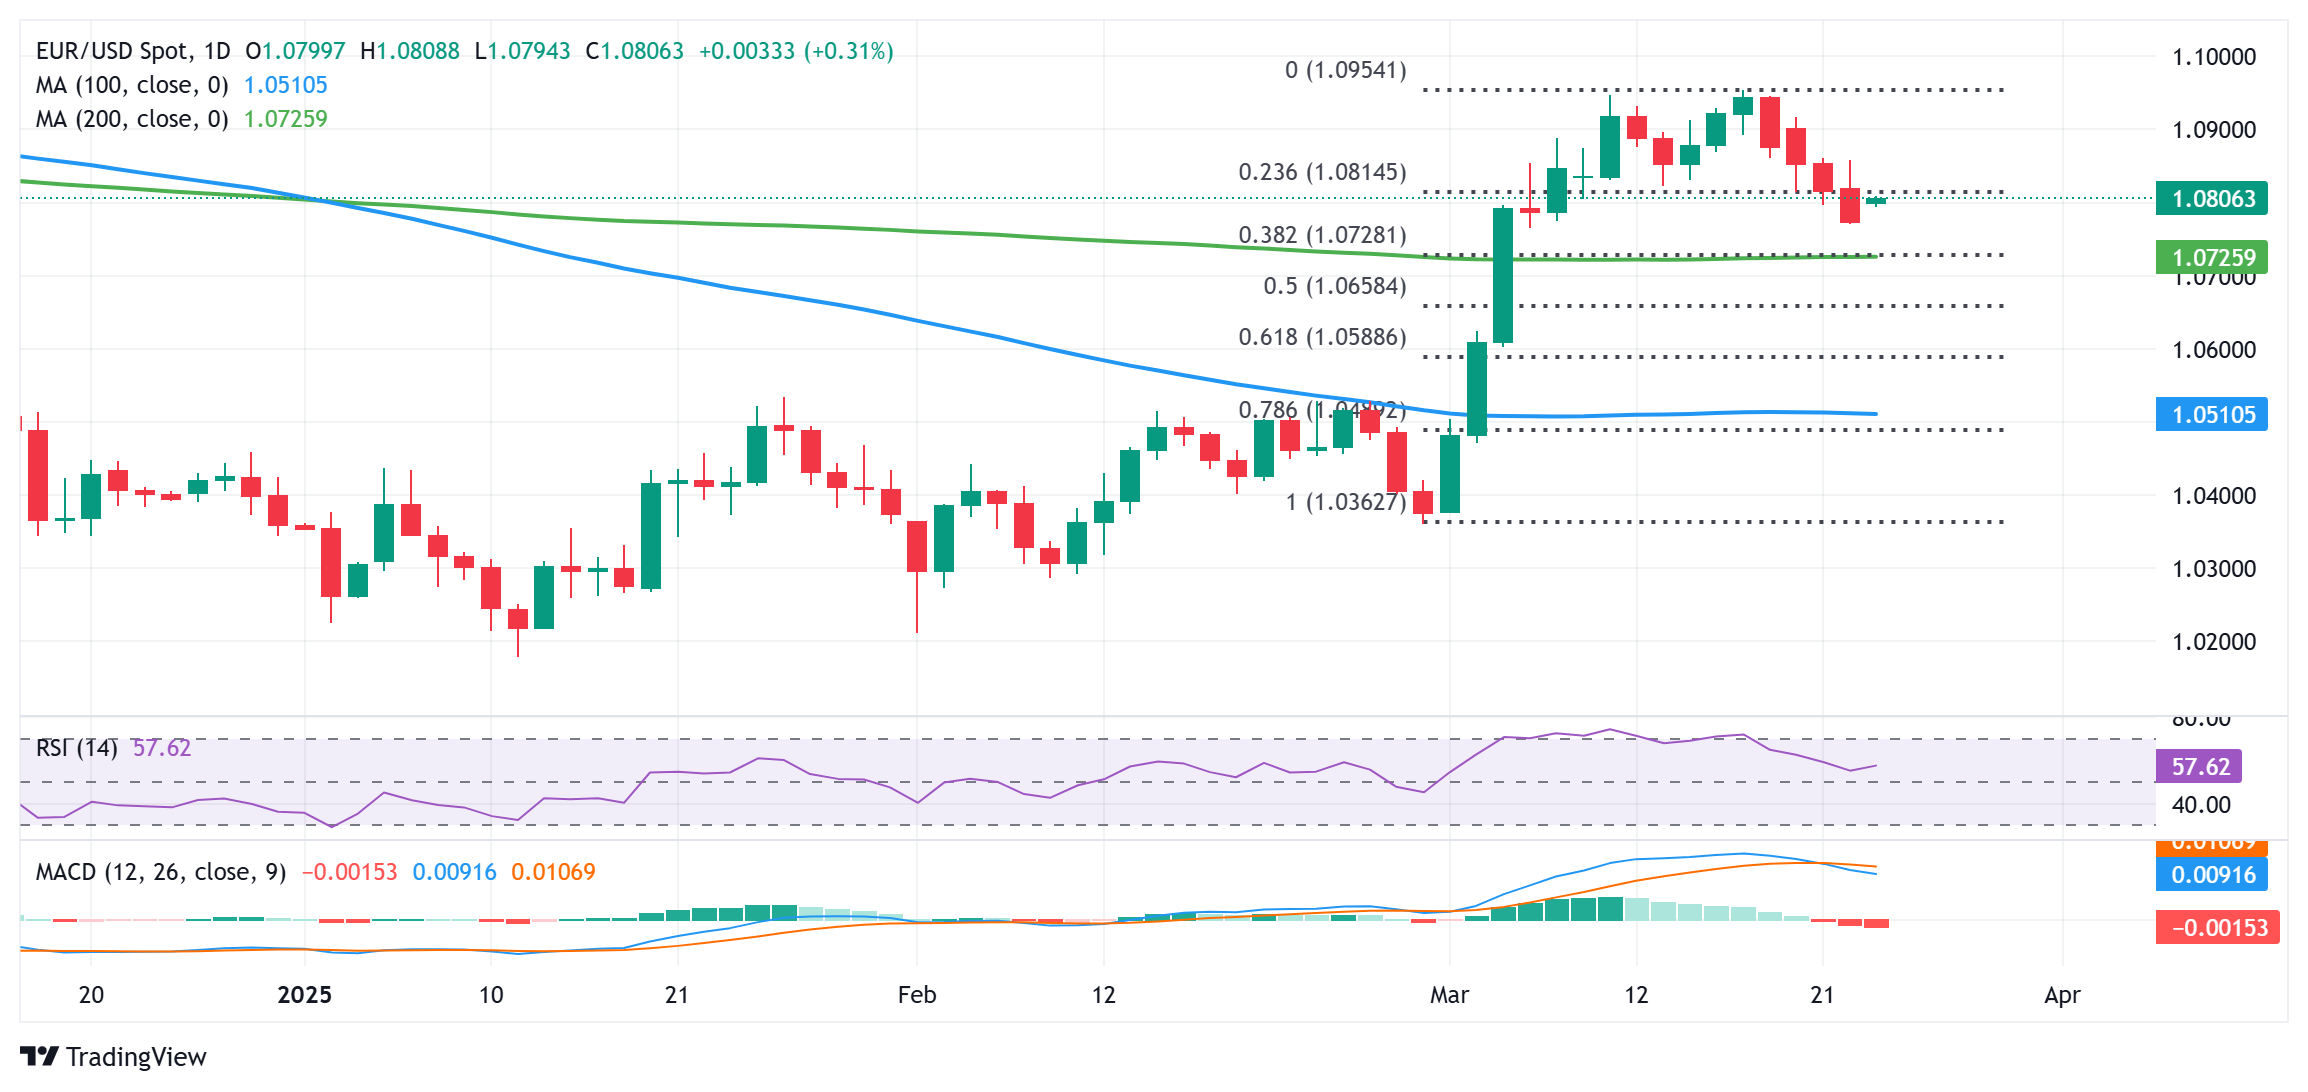
From a technical perspective, the overnight breakdown and close below the 23.6% Fibonacci retracement level of the recent move up from the late February low was seen as a key trigger for bearish traders. This, in turn, supports prospects for an extension of the recent pullback from the year-to-date top touched earlier this week and a further downfall toward the 1.0725 confluence. The latter comprises the 38.2% Fibo. level and the very important 200-day Simple Moving Average (SMA), which, in turn, should act as a strong base for the EUR/USD pair amid mixed oscillators on the daily chart.
A convincing break below, however, will suggest that spot prices have topped out near the 1.0955 region and pave the way for deeper losses. The subsequent downfall could drag the EUR/USD pair below the 1.0700 round figure, towards the next relevant support near the 1.0655 area (50% Fibo.) en route to the sub-1.0600 levels, or the 61.8% Fibo. Some follow-through selling might then shift the bias in favor of bearish traders and expose the 100-day SMA, around the 1.0500 psychological mark, which also nears the 78.6% Fibo. level.
On the flip side, the overnight swing high, around the 1.0855 region, now seems to act as an immediate hurdle, above which a bout of a short-covering move could allow the EUR/USD pair to reclaim the 1.0900 round figure. The momentum could extend further towards retesting the multi-month peak, around the 1.0955 region, before spot prices eventually climb to the 1.1000 psychological mark for the first time since early October 2024.
EUR/USD daily chart
* The content presented above, whether from a third party or not, is considered as general advice only. This article should not be construed as containing investment advice, investment recommendations, an offer of or solicitation for any transactions in financial instruments.


