


EUR/USD remains weak near 1.0305 in Tuesday’s early European session.
The pair keeps the negative outlook below the 100-day EMA with a bearish RSI indicator.
The initial support emerges at 1.0250; the first upside barrier is located at 1.0406.
The EUR/USD pair extends its downside to around 1.0305 during the early European session on Tuesday. The Greenback strengthens after US President Donald Trump moved to substantially raise tariffs on steel and aluminium imports and said he would announce plans to impose reciprocal tariffs on other countries over the coming days.
Technically, the bearish outlook of EUR/USD remains in play as the major pair remains capped below the key 100-day Exponential Moving Average (EMA) on the daily chart. Furthermore, the downward momentum is supported by the Relative Strength Index (RSI), which is located below the midline around 42.20, suggesting that the path of least resistance is to the downside.
The first downside target for the major pair emerges at 1.0250, the lower limit of the Bollinger Band. Extended losses could see a drop to the 1.0210-1.0200 zone, representing the low of February 3 and the psychological mark. A decisive break below the mentioned level could pave the way to 1.0088, the high of October 26, 2022.
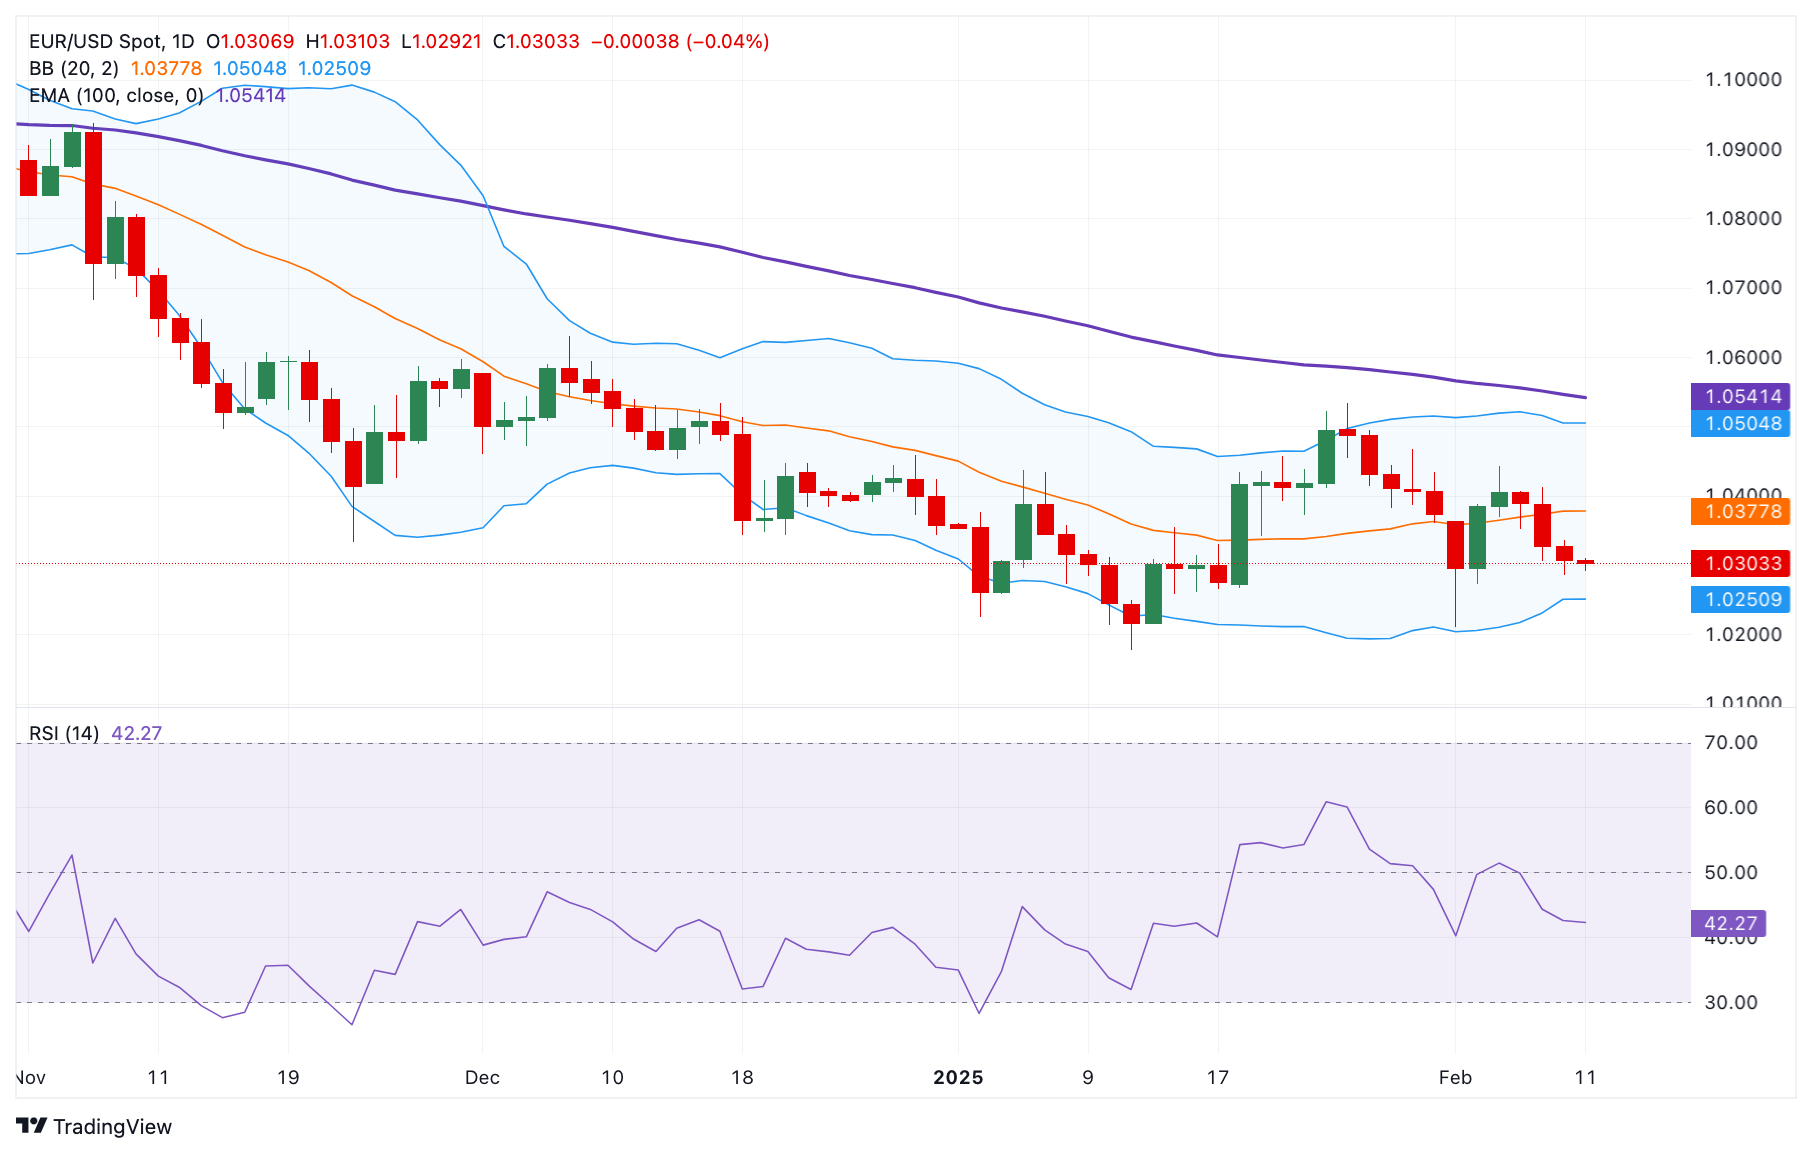
On the bright side, the high of February 6 at 1.0406 acts as an immediate resistance level for the cross. Sustained trading above this level could attract some buyers to 1.0504, the upper boundary of the Bollinger Band. Further north, the next hurdle is seen at 1.0541, the 100-day EMA.
EUR/USD daily chart
* The content presented above, whether from a third party or not, is considered as general advice only. This article should not be construed as containing investment advice, investment recommendations, an offer of or solicitation for any transactions in financial instruments.


