PEPE Price Forecast: PEPE could rally to double digits if it breaks above its key resistance level

FXStreet
Updated
Mitrade
coverImg
Source: DepositPhotos

Pepe price approaches its descending trendline on Tuesday; a breakout indicates a bullish move ahead.


PEPE's long-to-short ratio hints at a rally as bullish bets among the traders reach the highest in over a month.


Traders should be cautious, as Lookonchain data shows that a whale has sold 438 billion Pepe tokens.  


Pepe (PEPE) memecoin approaches its descending trendline, trading around $0.000007 on Tuesday; a breakout indicates a bullish move ahead. Moreover, PEPE's long-to-short ratio supports a bullish thesis as bullish bets among the traders reach the highest over a month, aiming for double-digit gains on the horizon.


Pepe price could rally if it closes above its descending trendline 


Pepe's price faced a rejection around its descending trendline (drawn by connecting multiple high levels since early December) on March 27 and declined 18.43% until Sunday. This trendline roughly coincides with the 50-day EMA at around $0.000008, making it a key resistance zone and breakout favoring the bulls. However, on Monday, at the start of this week, it recovered by nearly 4%. At the time of writing on Tuesday, it approaches its descending trendline. 


Assuming Pepe breaks above the descending trendline and closes above its 50-day EMA, this price action indicates a bullish outlook. Such a development could extend PEPE's rally by 25% from the $0.000008 level to retest its February 14 high of $0.00001.


The Relative Strength Index (RSI) on the daily chart reads 47, pointing upward toward its neutral level of 50, indicating fading bearish momentum. For the bullish momentum to be sustained, the RSI must move above its neutral level to support a recovery rally.
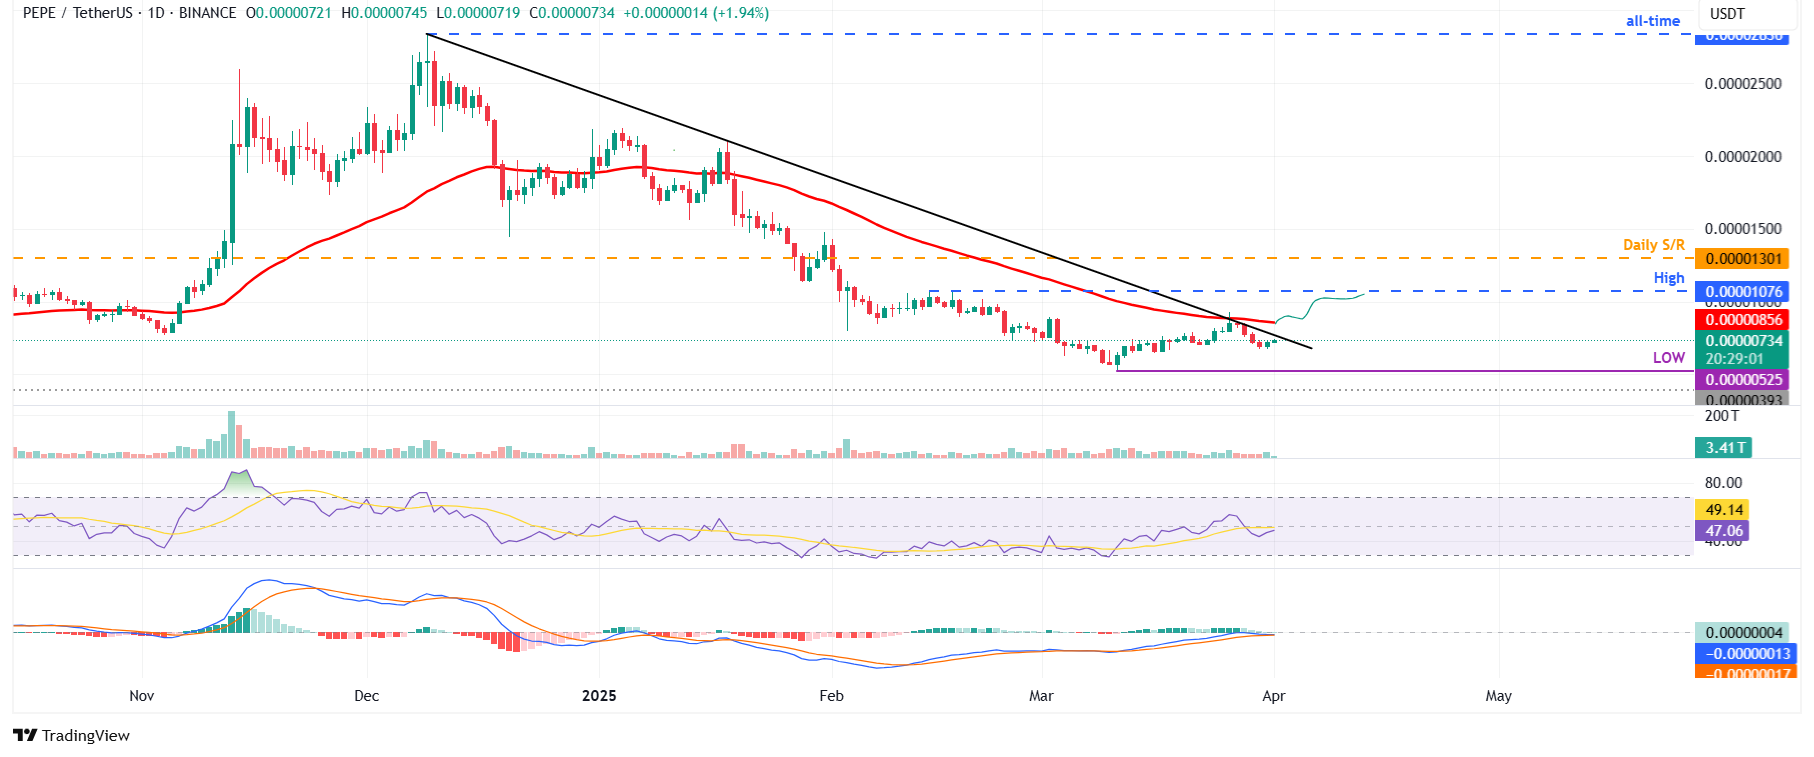

PEPE/USDT daily chart

PEPE/USDT daily chart


Another thesis supporting PEPE's bullish outlook is Coinglass's long-to-short ratio. The data for the frog theme-based memecoin reads 1.01, the highest level over a month. This ratio above one reflects bullish sentiment in the markets as more traders are betting for the asset price to rise.


PEPE long-to-short ratio chart. Source: Coinglass

PEPE long-to-short ratio chart. Source: Coinglass


However, traders should exercise caution, as Lookonchain data shows that a whale sold 438 billion PEPE tokens worth $3.03 million on Monday, incurring a $434K loss; this significant sell-off could increase downward pressure, potentially invalidating the bullish thesis and triggering a price decline for PEPE.ect over $400 million

* The content presented above, whether from a third party or not, is considered as general advice only.  This article should not be construed as containing investment advice, investment recommendations, an offer of or solicitation for any transactions in financial instruments.

goTop
quote
Do you find this article useful?
Related Articles
placeholder
Bitcoin Price Struggling but Short-Term Holders Might Be Setting the Stage for $150KBitcoin has recently displayed signs of upward momentum, trading at $85,215, marking a 2.2% increase in just the past day. Despite this short-term gain, the asset remains down by over 21.2% from its
Author  NewsBTC
5 hours ago
Bitcoin has recently displayed signs of upward momentum, trading at $85,215, marking a 2.2% increase in just the past day. Despite this short-term gain, the asset remains down by over 21.2% from its
placeholder
EOS Surges Over 20% Today, Reaches Two-Month High!TradingKey - EOS has jumped 20% to $0.80. It may soon challenge $1. On Wednesday, April 2, the crypto market continued its rebound. EOS surged over 20%. This morning, EOS quickly rose to a high of $0.
Author  TradingKey
5 hours ago
TradingKey - EOS has jumped 20% to $0.80. It may soon challenge $1. On Wednesday, April 2, the crypto market continued its rebound. EOS surged over 20%. This morning, EOS quickly rose to a high of $0.
placeholder
Ethereum Price Approaches Resistance—Will It Smash Through?Ethereum price started a recovery wave above the $1,850 level. ETH is now consolidating and facing key hurdles near the $1,920 level. Ethereum started a recovery wave above $1,820 and $1,850 levels.
Author  NewsBTC
8 hours ago
Ethereum price started a recovery wave above the $1,850 level. ETH is now consolidating and facing key hurdles near the $1,920 level. Ethereum started a recovery wave above $1,820 and $1,850 levels.
placeholder
Top 3 Price Prediction Bitcoin, Ethereum, Ripple: BTC, ETH, and XRP brace for volatility amid Trump’s ‘Liberation Day’Bitcoin (BTC) price faces a slight rejection around its $85,000 resistance level on Wednesday after recovering 3.16% the previous day.
Author  FXStreet
8 hours ago
Bitcoin (BTC) price faces a slight rejection around its $85,000 resistance level on Wednesday after recovering 3.16% the previous day.
placeholder
Dogecoin 4-Hour Heikin Ashi Chart Shows Oversold Levels, A Bounce On The HorizonDogecoin is showing early signs of life after a weeklong downtrend, as new technical signals on the 4-hour Heikin Ashi chart suggest the meme coin may be pivoting toward recovery. The Dogecoin 4-hour candlestick Relative Strength Index (RSI) indicator is flashing oversold conditions and a falling wedge pattern forming at support, creating what might be […]
Author  Bitcoinist
8 hours ago
Dogecoin is showing early signs of life after a weeklong downtrend, as new technical signals on the 4-hour Heikin Ashi chart suggest the meme coin may be pivoting toward recovery. The Dogecoin 4-hour candlestick Relative Strength Index (RSI) indicator is flashing oversold conditions and a falling wedge pattern forming at support, creating what might be […]
Real-time Quote