

Silver attracts some buyers near the 100-day SMA pivotal support on Friday.
The setup favors support prospects for a breakdown below the said support.
Any further move up could be seen as a selling opportunity and remain capped.
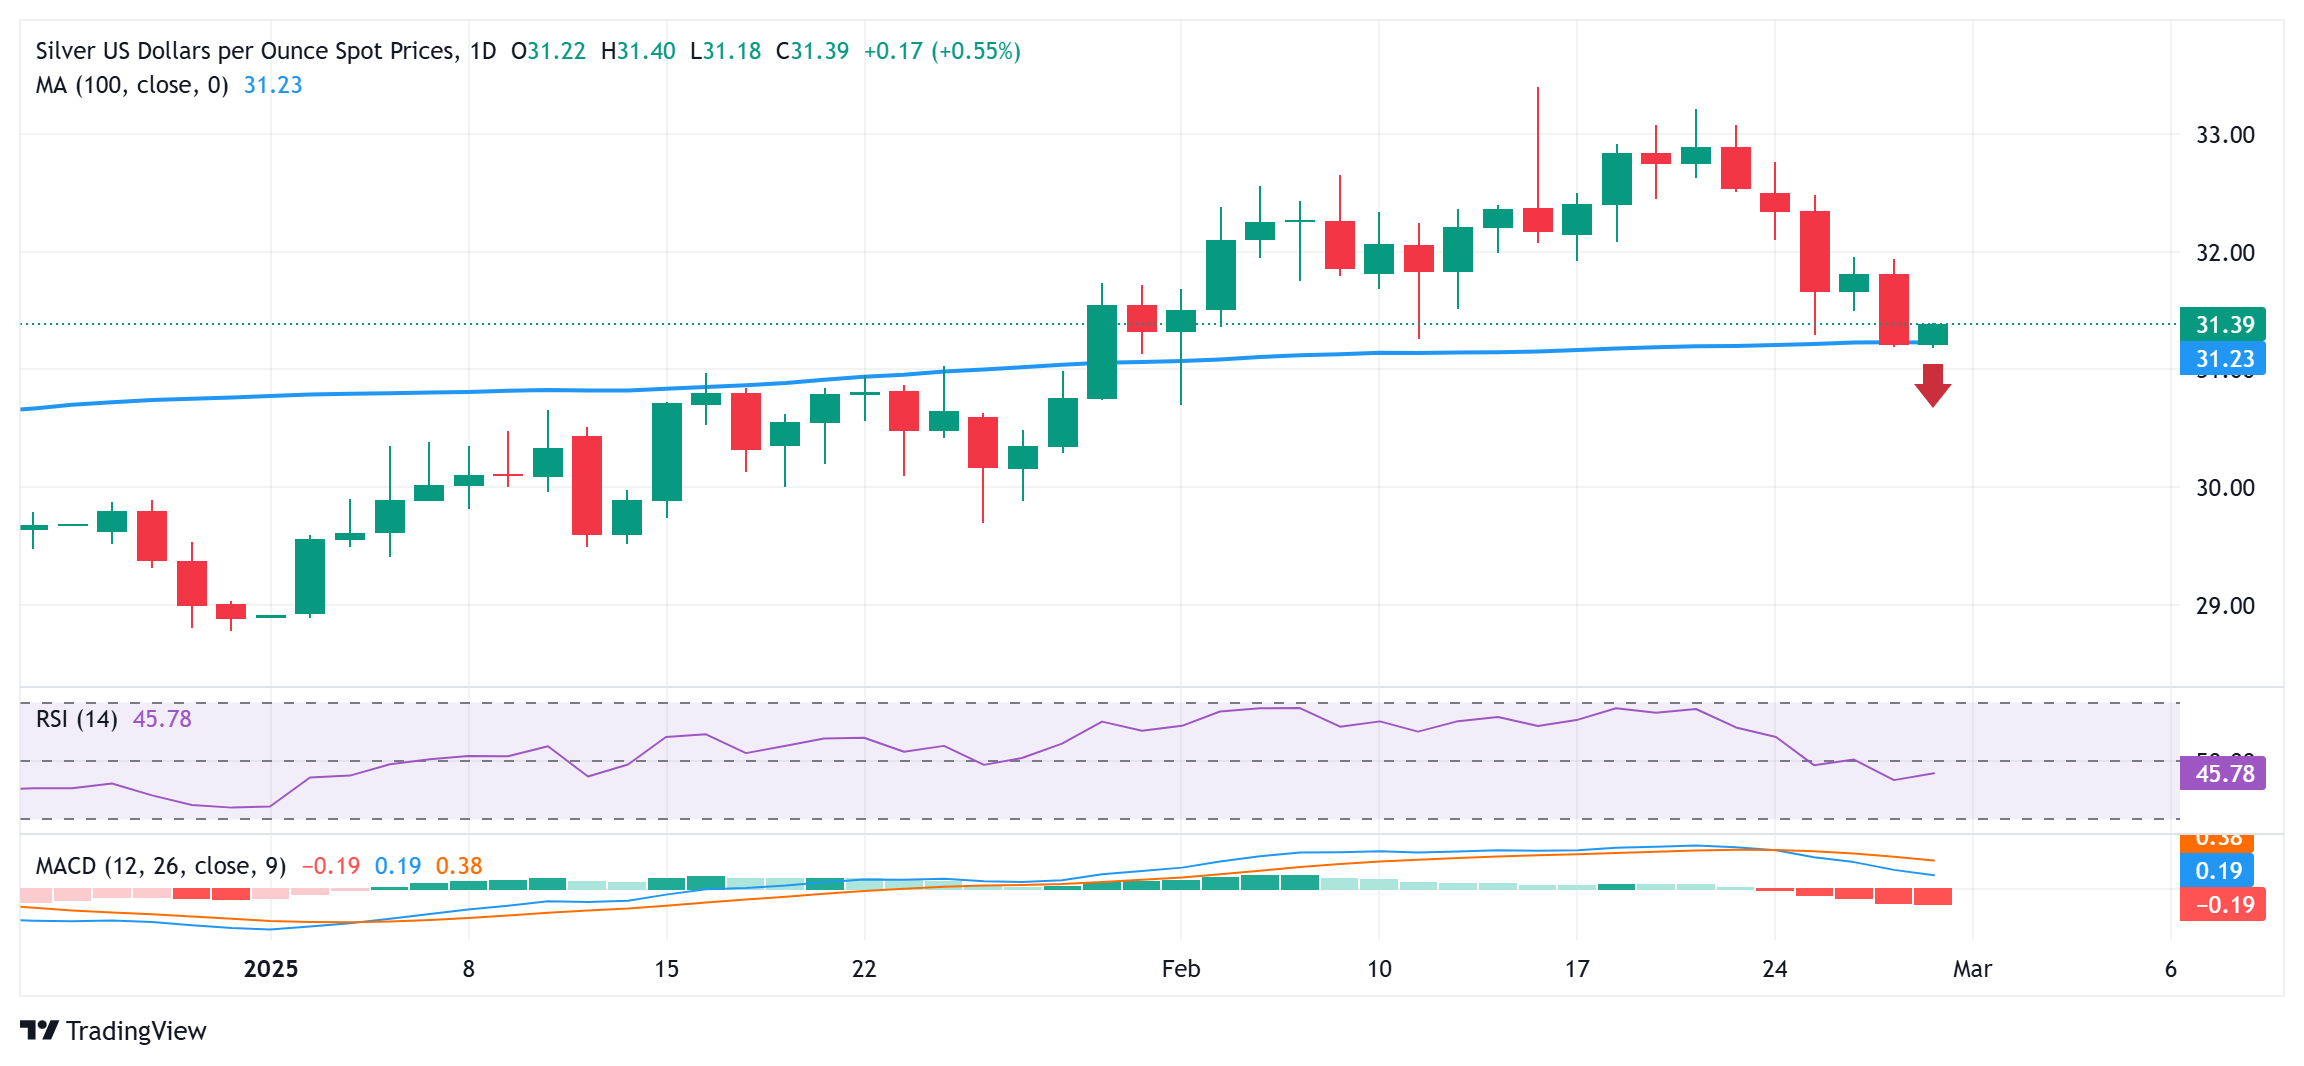
Silver (XAG/USD) defends the 100-day Simple Moving Average (SMA) support and stages a modest recovery from a four-week low touched during the Asian session on Friday. The white metal currently trades around the $31.35 region, up over 0.30% for the day, though it lacks follow-through buying as traders keenly await the release of the US Personal Consumption Expenditure (PCE) Price Index.
From a technical perspective, oscillators on the daily chart have been gaining negative traction and support prospects for an extension of over a one-week-old downtrend. That said, it will still be prudent to wait for a convincing break below the 100-day SMA support, currently pegged near the $31.15 region, before positioning for further losses. The XAG/USD might then weaken below the $31.00 mark, towards the next relevant support near the $30.25 region.
The downward trajectory could extend further towards the $30.00 psychological mark, which if broken decisively will suggest that the XAG/USD has topped out in the near term and pave the way for a further depreciating move. The subsequent downfall has the potential to drag the white metal towards the $29.55-$29.50 horizontal support en route to the $29.00 round figure and December 2024 swing low, around the $28.80-$28.75 area.
On the flip side, any further move up is likely to confront some resistance near the $31.65 region ahead of the overnight swing high, around the $32.00 neighborhood. A sustained strength beyond the latter could trigger a short-covering rally and lift the XAG/USD to the $32.40-$32.45 hurdle. Bulls might then make a fresh attempt to conquer the $33.00 mark before aiming to test the monthly swing high, around the $33.40 area touched on February 14.
Silver daily chart
* The content presented above, whether from a third party or not, is considered as general advice only. This article should not be construed as containing investment advice, investment recommendations, an offer of or solicitation for any transactions in financial instruments.


