
Solana drops below $160, liquidating $26 million in leverage as negative funding rate weighs in

- Gold Price Forecast: XAU/USD drifts higher above $4,200 as Fed delivers expected cut
- Gold Price Steady Climb and the Sudden Surge of Silver and Copper: Will Their Bull Run Extend Into 2026?
- Gold Price Forecast: XAU/USD climbs above $4,250 as Fed rate cut weakens US Dollar
- Bitcoin Cash Unveiled: Why Did BCH Price Surpass BTC? Can it Soar to $1,000 in the Future?
- Silver Price Forecast: XAG/USD refreshes record high, looks to build on move beyond $61.00
- AUD/USD holds steady below 0.6650, highest since September ahead of China's trade data

Solana price extends its decline on Monday after falling over 11% last week.
The recent correction in SOL has triggered a wave of over $26 million in liquidations in the last 24 hours.
The technical outlook and funding rate suggest a further pullback targeting the $120 mark.
Solana (SOL) price extends its decline and trades around $160 on Monday after falling over 11% last week. The recent correction in SOL has triggered a wave of over $26 million in liquidations in the last 24 hours and $110 million last week. The technical outlook and funding rate suggest a further pullback targeting the $120 mark.
Solana price dips, wiping over $26 million in the last 24 hours
Solana's price declined almost 11% last week and continued falling on Monday, reaching below $160 in the early European session. This correction has triggered a wave of liquidations, resulting in over $26.25 million in liquidations in the last 24 hours and $110 million last week, according to data from CoinGlass.
Strong liquidations like this could spark Fear, Uncertainty, and Doubt (FUD) among Solana investors, raising selling pressure and leading to a further decline in SOL price.
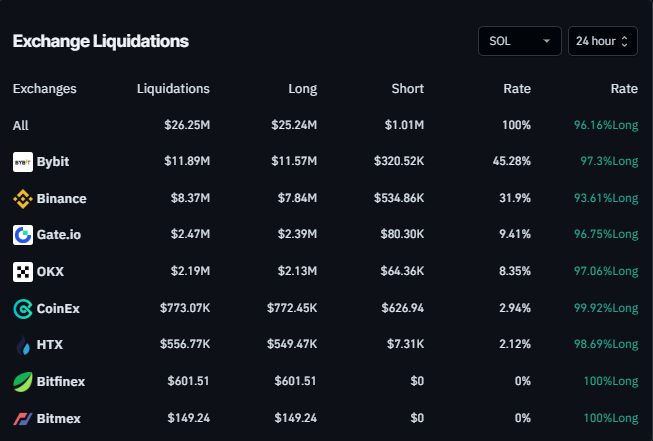
Solana liquidation chart last 24 hours. Source: Coinglass
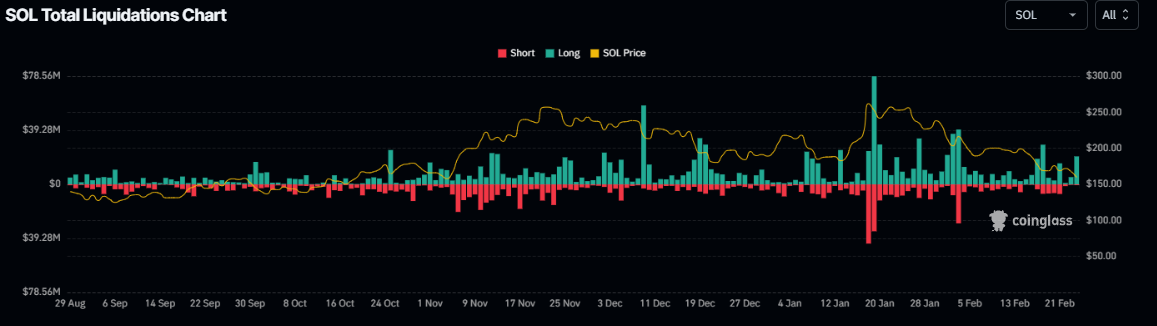
SOL total liquidation chart. Source: Coinglass
Additionally, according to Coinglass's OI-Weighted Funding Rate data, the number of traders betting that the price of Solana will slide further is higher than that anticipating a price increase.
This index is based on the yields of futures contracts, which are weighted by their Open Interest (OI) rates. Generally, a positive rate (longs pay shorts) indicates bullish sentiment, while negative numbers (shorts pay longs) indicate bearishness.
In the case of SOL, this metric stands at -0.0023%, reflecting a negative rate and indicating that shorts are paying longs. This scenario often signifies bearish sentiment in the market, suggesting potential downward pressure on SOL's price.
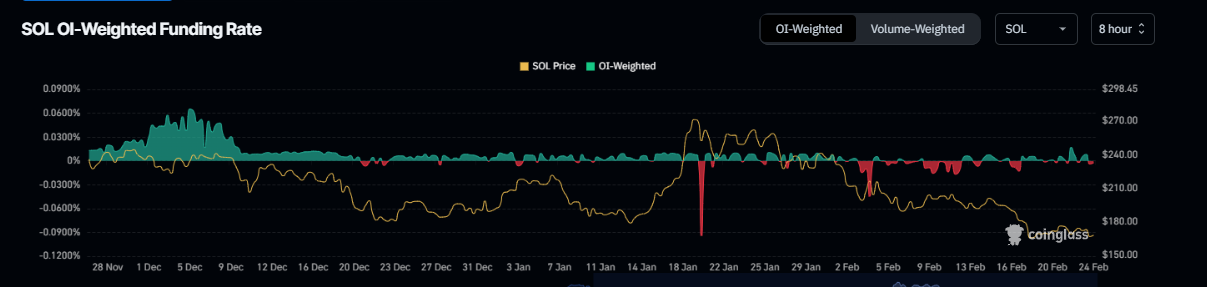
SOL OI-Weighted Funding Rate chart. Source: Coinglass
Solana Price Forecast: Bears look strong
Solana price has been declining for five consecutive weeks since it reached an all-time high of $295.83 on January 19. Only last week, it crashed by almost 11%. At the start of this week on Monday, SOL continues to trade down, falling below the $160 mark for the first time since early November.
If SOL continues to correct, it could extend to restest its next daily support at $120.91.
The Relative Strength Index (RSI) on the daily chart reads 31, indicating strong bearish momentum still out of oversold levels. Moreover, the Moving Average Convergence Divergence (MACD) indicator shows red histograms below its neutral level of zero, indicating a strong bearish trend.
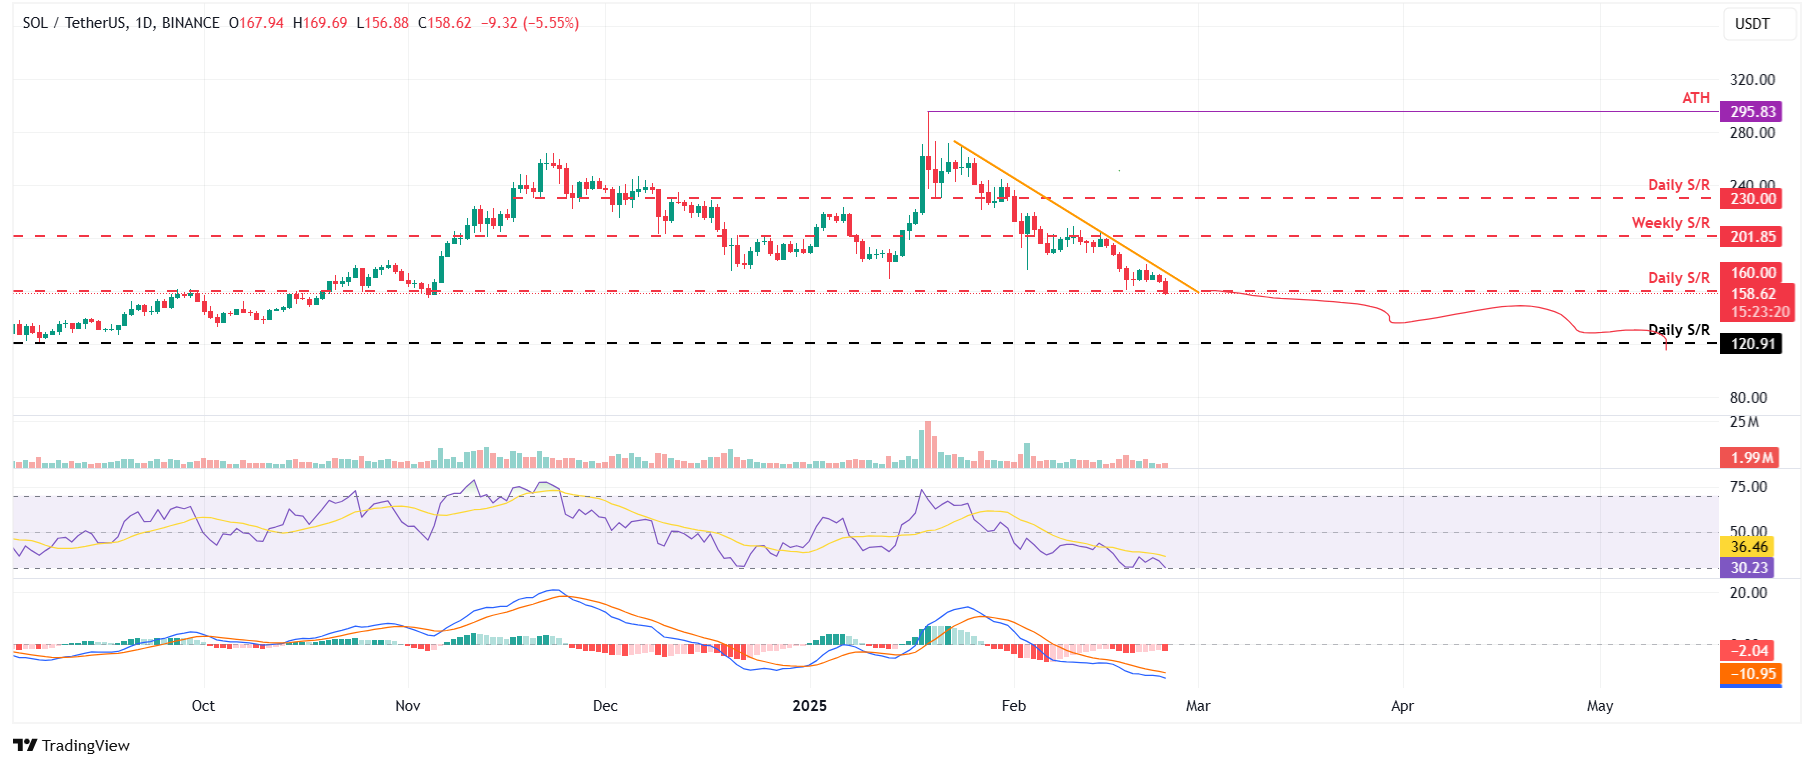
SOL/USDT daily chart
Read more
* The content presented above, whether from a third party or not, is considered as general advice only. This article should not be construed as containing investment advice, investment recommendations, an offer of or solicitation for any transactions in financial instruments.


