Fantom bulls eye yearly high as BTC rebounds

FXStreet
Updated
Tony
coverImg
Source: DepositPhotos


  • Fantom price extends its rally by 8% until Thursday, after gaining 43% in the previous week.


  • FTM’s daily trading volume reaches 1.34 billion on Tuesday, the highest level since April 2022.


  • Fantom’s Open Interest is also rising, suggesting new money is entering the market.


Fantom (FTM) continued its rally and rallied 8% until Thursday, trading above $1.09 after 43% gains in the previous week. Like FTM, most altcoins have continued the rally as Bitcoin (BTC) recovers from its recent pullback this week. 


On-chain data further support the bullish outlook as FTM’s daily trading volume and Open Interest (OI) reach record levels, indicating the continuation of the rally.


Fantom price is poised for a rally, targeting the yearly high of $1.22


Fantom price continues its rally this week, gaining over 8% until Thursday. If the upward momentum continues, FTM could extend the rally to retest its yearly high of $1.22, set in March.


A successful close above the yearly high could extend additional gains toward the $1.45 weekly resistance level.


The Relative Strength Index (RSI) on the weekly chart reads 67, well above its neutral value of 50 and points upwards, suggesting bullish momentum is gaining traction.
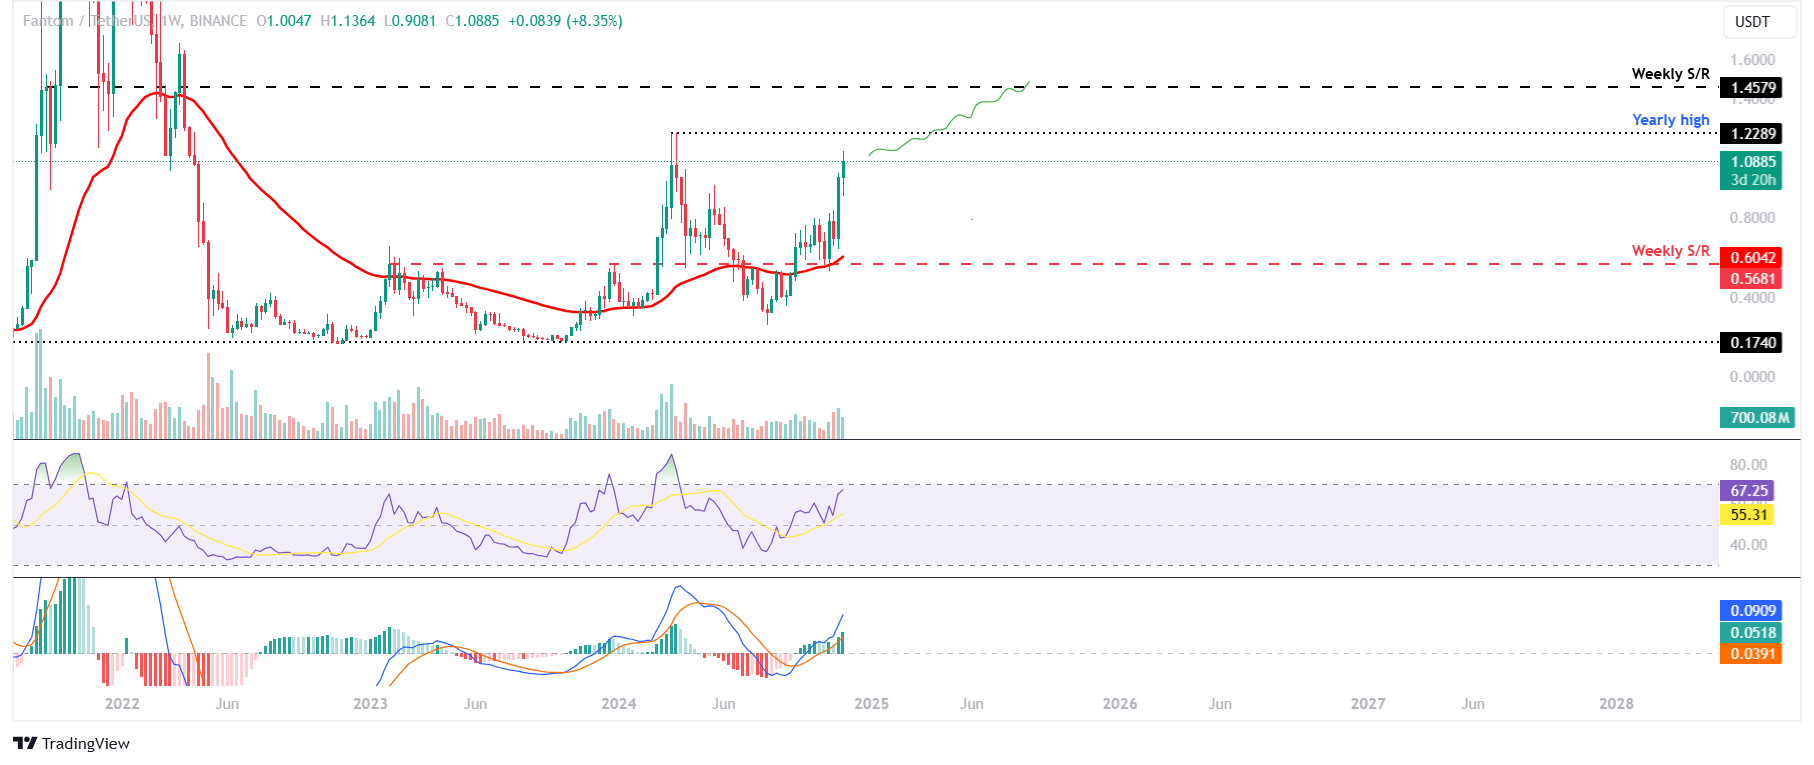

FTM/USDT weekly chart

FTM/USDT weekly chart


Another aspect bolstering the platform’s bullish outlook is a recent surge in traders’ interest and liquidity in the Fantom chain. Santiment’s data shows that FTM Chain’s daily trading volume rose from $387.6 million on November 22 to $1.34 billion on Tuesday, the highest since April 2022. 


FTM daily trading volume chart. Source: Santiment

FTM daily trading volume chart. Source: Santiment


Fantom’s Open Interest (OI) is also supporting the bullish outlook. Coinglass’s data shows that the futures’ OI in FTM at exchanges almost doubled from $213.51 million on November 22 to $405.14 million on Wednesday, the highest level since mid-March. An increasing OI represents new or additional money entering the market and new buying, which suggests a rally ahead in the Fantom price.


FTM Open Interest chart. Source: Coinglass

FTM Open Interest chart. Source: Coinglass

* The content presented above, whether from a third party or not, is considered as general advice only.  This article should not be construed as containing investment advice, investment recommendations, an offer of or solicitation for any transactions in financial instruments.

goTop
quote
Do you find this article useful?
Related Articles
placeholder
Crypto Oversight May Shift To CFTC Under Trump Administration: ReportAccording to a report by Fox Business, citing sources familiar with the matter, the incoming Donald Trump administration may empower the Commodity Futures Trading Commission (CFTC) to regulate certain crypto assets.
Author  Bitcoinist
2 hours ago
According to a report by Fox Business, citing sources familiar with the matter, the incoming Donald Trump administration may empower the Commodity Futures Trading Commission (CFTC) to regulate certain crypto assets.
placeholder
Dogecoin Hits Critical Resistance: Will It Surge Past $0.40 or Face a Price Dip?Analysts suggest this price marks a critical juncture that could significantly influence Dogecoin’s trajectory in the coming days.
Author  NewsBTC
2 hours ago
Analysts suggest this price marks a critical juncture that could significantly influence Dogecoin’s trajectory in the coming days.
placeholder
Dogecoin (DOGE) Gearing Up: Can It Overcome Resistance and Climb?Dogecoin is consolidating losses above the $0.3650 support against the US Dollar.
Author  NewsBTC
Yesterday 05: 51
Dogecoin is consolidating losses above the $0.3650 support against the US Dollar.
placeholder
Polkadot Q3 Digest: Examining The Network’s Growth, Challenges, And Future ProspectsMarket intelligence firm Messari recently released its third quarter (Q3) performance report for Polkadot (DOT), providing insights into the blockchain network’s development and financial metrics during this period.
Author  FXStreet
Yesterday 05: 45
Market intelligence firm Messari recently released its third quarter (Q3) performance report for Polkadot (DOT), providing insights into the blockchain network’s development and financial metrics during this period.
placeholder
PEPE Price Drops After 105% Monthly Gains: How Long Will the Correction LastPEPE’s price hit a new all-time high on November 13, after it was listed on Coinbase. It has been up 105% in the past month, though it’s down nearly 10% in the last seven days. Indicators like RSI and MVRV suggest further corrections could occur as bullish momentum weakens.
Author  Beincrypto
Yesterday 02: 25
PEPE’s price hit a new all-time high on November 13, after it was listed on Coinbase. It has been up 105% in the past month, though it’s down nearly 10% in the last seven days. Indicators like RSI and MVRV suggest further corrections could occur as bullish momentum weakens.