
Analyst Predicts $4,000 Mid-Term Target for Ethereum, Declares End to ETH Correction


Ethereum (ETH) has been struggling with a significant downturn recently, leaving the asset deep in the red. Over the past week, Ethereum has recorded a 9.2% decline in value, reflecting broader market weakness.
However, the past 24 hours have brought a slight change in momentum, with ETH seeing a 3.2% increase in price. Though this uptick is not enough to erase the previous week’s losses, it may signal the beginning of a recovery phase.
Is Ethereum At The End Of Its Correction
According to the latest analysis from renowned crypto analyst Alex Clay on X, Ethereum might be gradually recovering because its recent bearish market might be concluding.
He emphasized that if ETH can maintain consolidation above key technical zones, specifically the 200-day moving average (MA) and 200-day exponential moving average (EMA), it would provide a strong foundation for an upward rally.
A significant price break above the $2,500 mark could confirm that the correction has ended and the asset is primed for recovery. Furthermore, while Clay had previously been optimistic about Ethereum reaching a much higher price target, he has revised his expectations based on recent market conditions.
#ETH/USD
Imo we are at the end of the $ETH correction
Looking for some consolidation above the Key Zone + 200 MA & 200 EMA confluence
Break above $2500 will serve a confirmation of the beginning of the rally
#Ethereum turned to be a heavy asset so $10k target is rather… pic.twitter.com/jjGPPUHWE3
— Alex Clay (@cryptclay) September 9, 2024

Clay noted: “Ethereum turned to be a heavy asset, so $10k target is rather a dream than reality so I changed my mind.” For now, the analyst has set more realistic targets, with a mid-term goal of $4,000 and long-term targets ranging from a conservative $6,255 to an optimistic $7,942.

Other Analysts Eye Falling Wedge Pattern As Key Indicator
Aside from Clay’s analysis, Ethereum’s technical chart has been the focus of several prominent analysts, including Anup Dhungana and Captain Faibik, who have recently identified the potential for a bullish breakout for ETH.
For instance, Dhungana’s ETH/BTC chart analysis suggests that a rebound from key support levels and a break from the falling wedge pattern could significantly increase Ethereum’s price.

For context, falling wedges are generally viewed as bullish reversal patterns in technical analysis, and confirming a breakout could signal an exponential upward trend.
Similarly, Captain Faibik echoed this sentiment, sharing an image of altcoin market chart that also displayed a falling wedge formation.
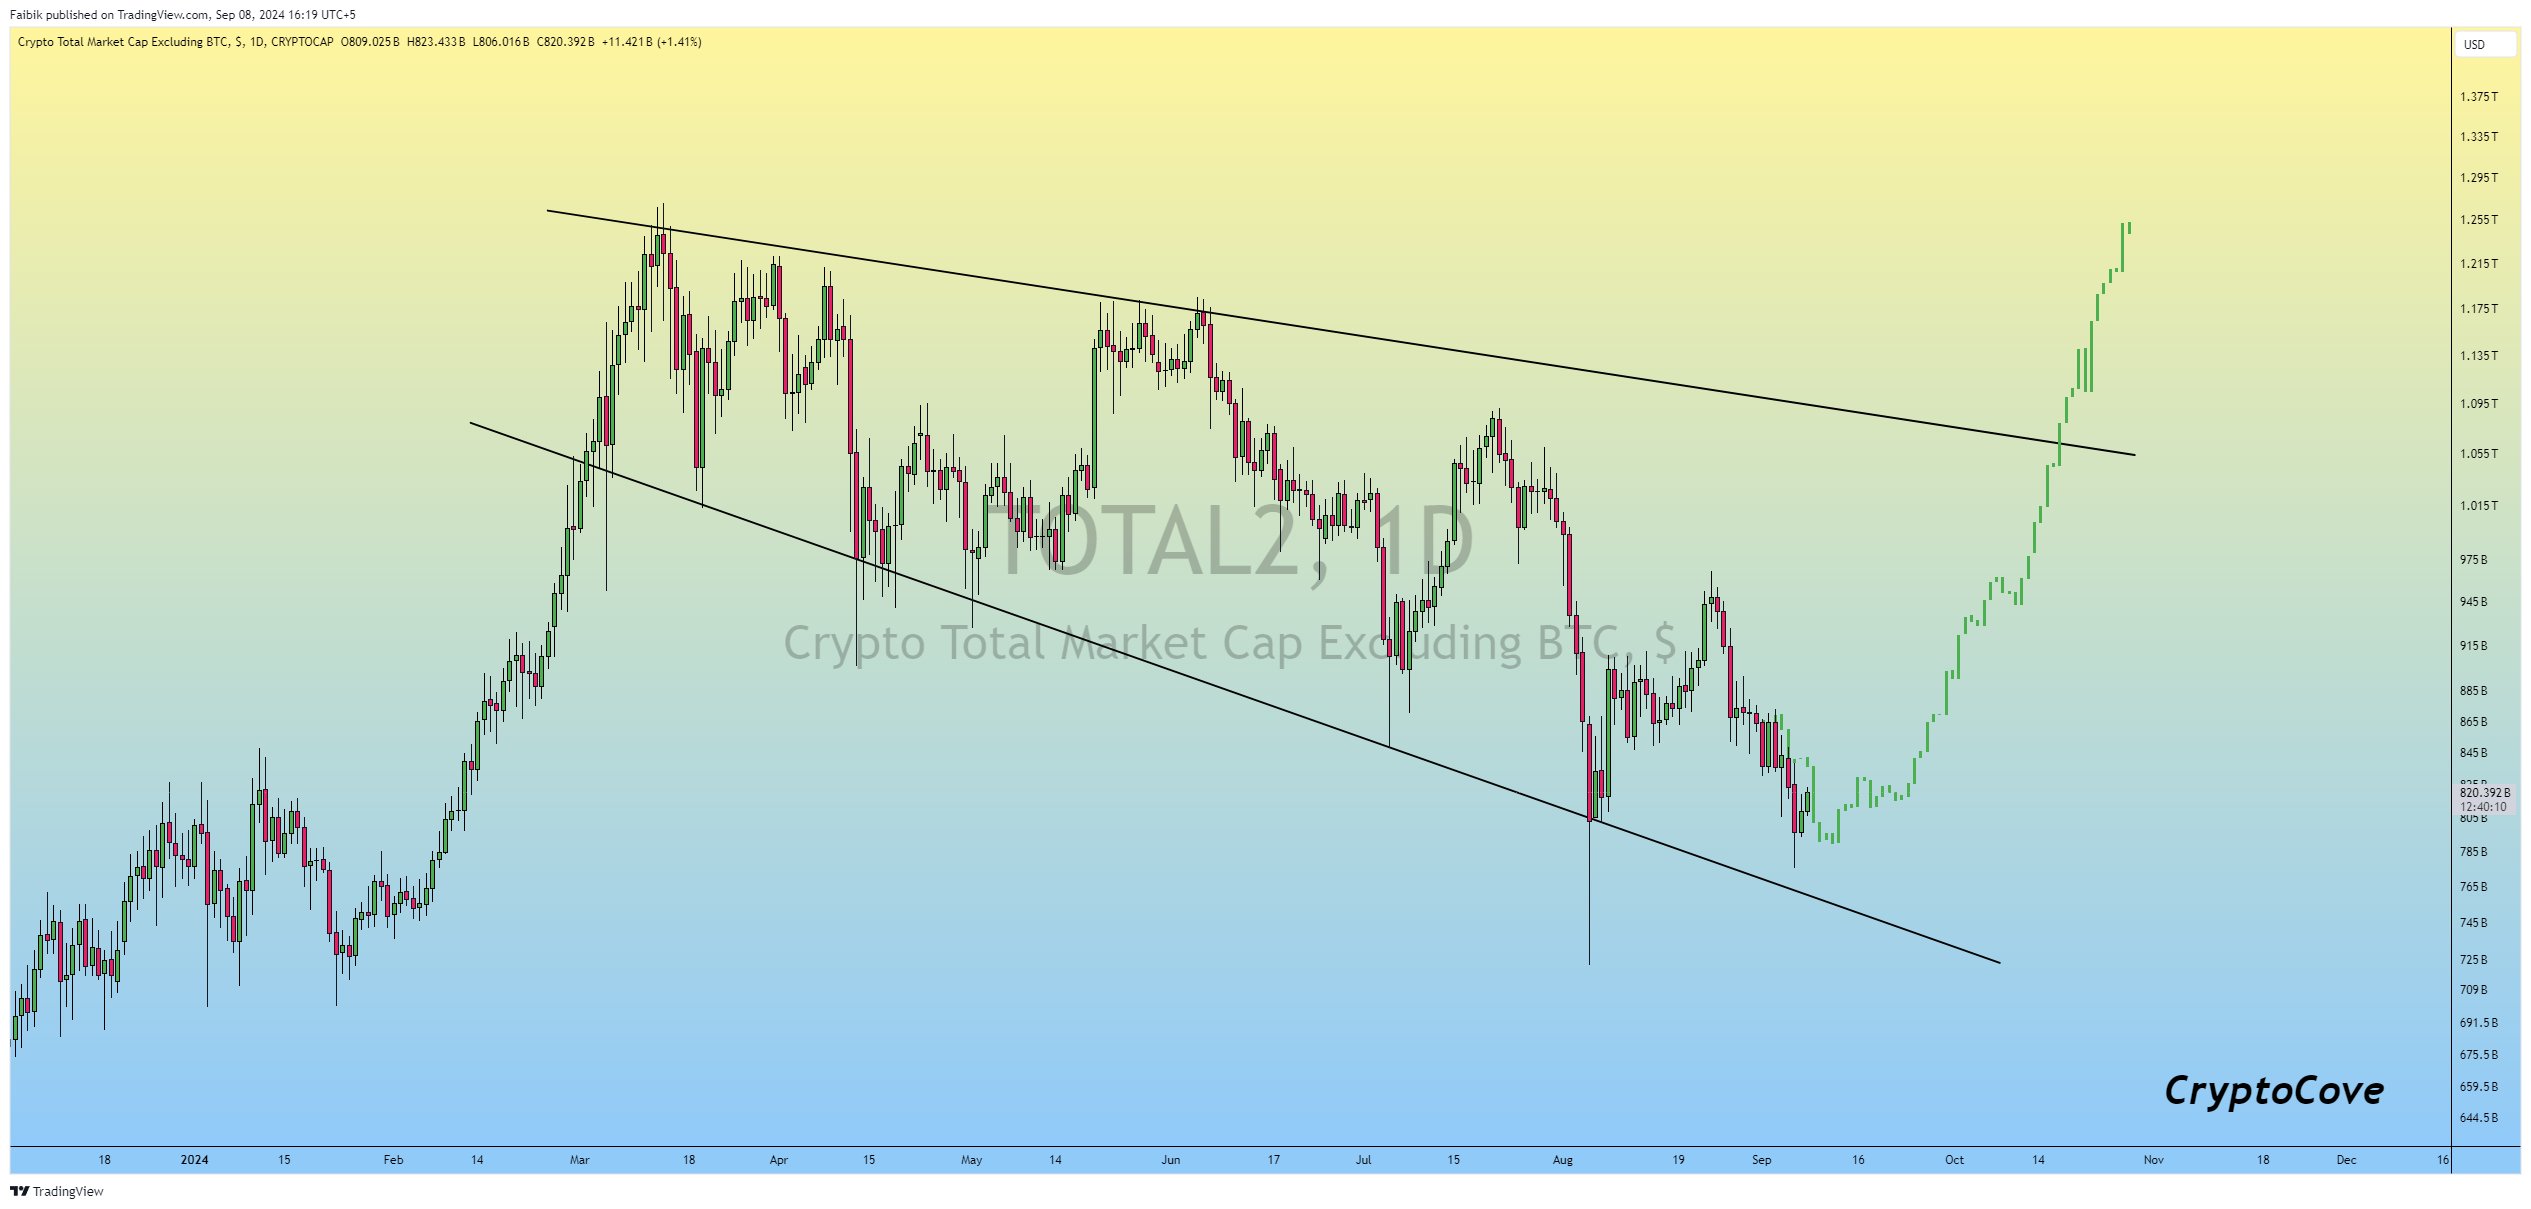
Faibik predicted that altcoins could break out of the wedge pattern shortly, potentially pushing major altcoins, including ETH, toward a recovery in the fourth quarter of 2024.
He advised investors to remain patient, accumulate altcoins, and prepare for a bounce back that could see prices return to their March 2024 highs.
Featured image from DALL-E, Chart from TradingView
* The content presented above, whether from a third party or not, is considered as general advice only. This article should not be construed as containing investment advice, investment recommendations, an offer of or solicitation for any transactions in financial instruments.


