

Top 3 Price Prediction Bitcoin, Ethereum, Ripple: BTC, ETH and XRP struggle despite Trump’s Bitcoin Reserve order

- Bitcoin Drops to $70,000. U.S. Government Refuses to Bail Out Market, End of Bull Market or Golden Pit?
- Gold rallies further beyond $5,050 amid flight to safety, dovish Fed expectations
- Bitcoin Bottom Debate: $70,000 or $50,000?
- A Crash After a Surge: Why Silver Lost 40% in a Week?
- Bitcoin Slips Below 75,000 Mark. Will Strategy Change Its Mind and Sell?
- Bitcoin Rout. Bridgewater Founder Dalio Publicly Backs Gold.

Bitcoin price is extending its decline on Friday after falling more than 7% so far this week.
Ethereum price is retesting its key support level at around $2,125; a close below would extend the correction.
XRP has fallen by 4.7% on Friday after correcting nearly 16% this week.
Bitcoin (BTC) price extends its decline, trading around $87,000 on Friday after falling more than 7% so far this week. Ethereum (ETH) and Ripple (XRP) prices followed in BTC’s footsteps and declined nearly 15% and 16%, respectively, despite Trump signing an executive order to create the US Strategic Bitcoin Reserve on Thursday.
Bitcoin price momentum indicator reflect weakness
Bitcoin price faced rejection around the $95,000 level on Sunday and declined 8.54% the next day. However, on Tuesday, BTC dipped below the daily support level at $85,000 but bounced and closed above it. This daily level roughly coincides with the 200-day Exponential Moving Average (EMA) at $85,843, making it a key support zone. At the time of writing on Friday, it trades down, finding support around the 200-day EMA at $85,843.
If BTC breaks below the 200-day EMA and closes below $85,000, it could extend the decline to retest its next support level at $73,000.
The Relative Strength Index (RSI) on the daily chart reads 41, which points downwards after rejecting from its neutral level of 50 earlier this week, indicating bearish momentum. The Moving Average Convergence Divergence (MACD) indicator coils around each other, suggesting indecisiveness among the traders.
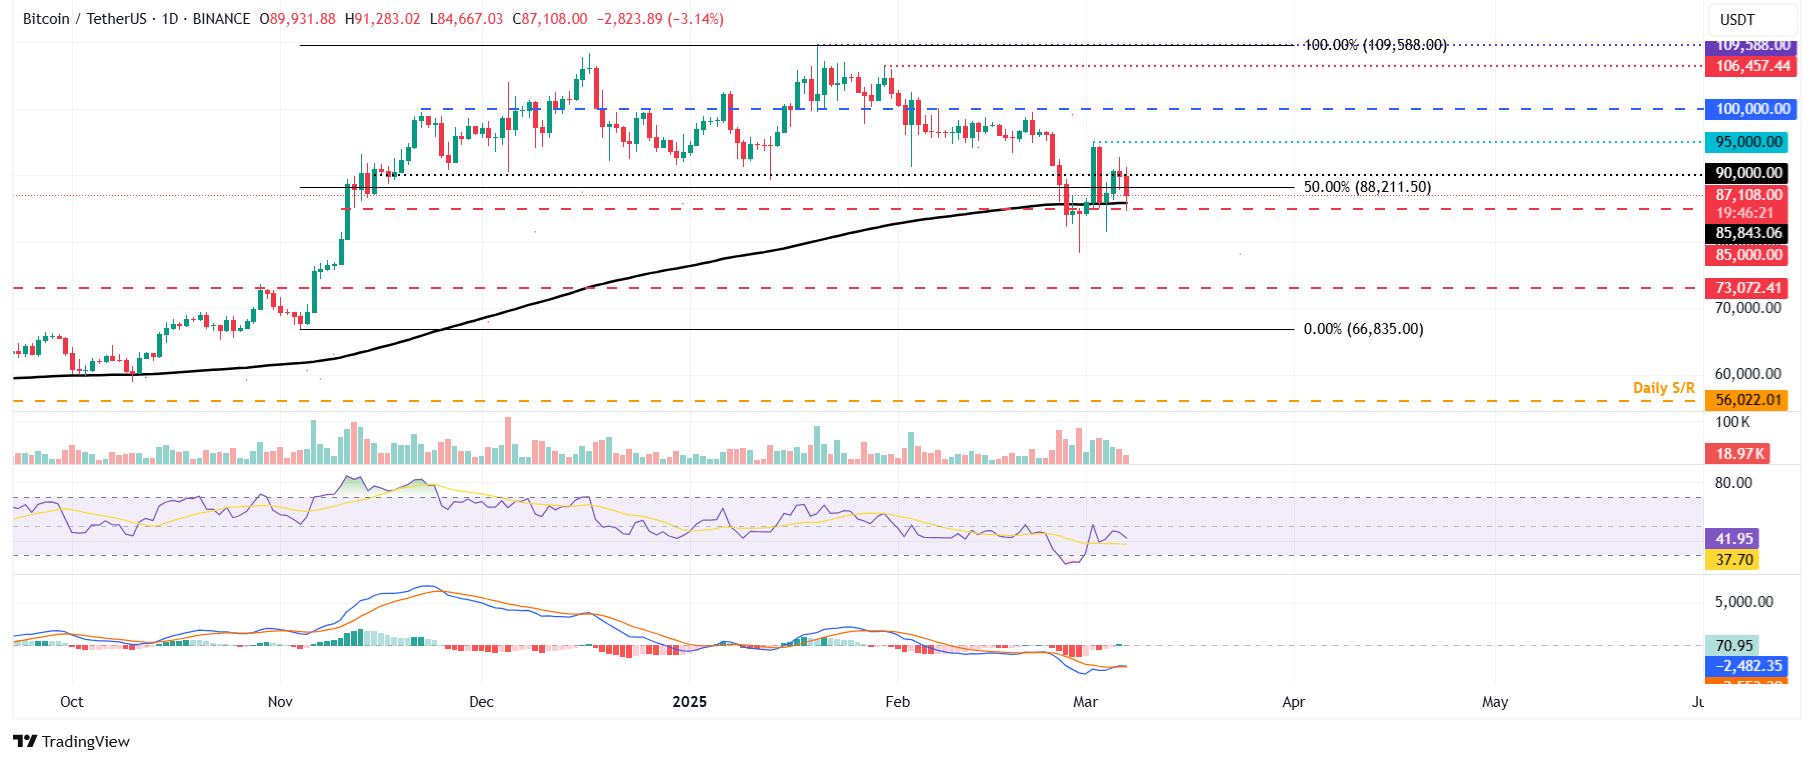
BTC/USDT daily chart
However, if the $85,000 level holds as support, BTC could extend the recovery to retest its Sunday high of $95,000.
Ethereum price is poised for a downleg if it closes below $2,125
Ethereum price found support around its $2,125 level on Saturday and rose 13.56%, closing above its daily resistance of $2,359 the next day. However, ETH erased its recent gains on Monday but found support around its $2,125 level the next day and recovered 3.65% by Wednesday. At the time of writing on Friday, it declines and approaches its $2,125 support level.
If ETH declines and closes below $2,125, it could extend the decline to retest its weekly support level of $1,905.
The RSI on the daily chart reads 35 after rejecting around its neutral level of 50 on Sunday, indicating bearish momentum. At the same time, its MACD also showed a bearish crossover last week, suggesting a downward trend.
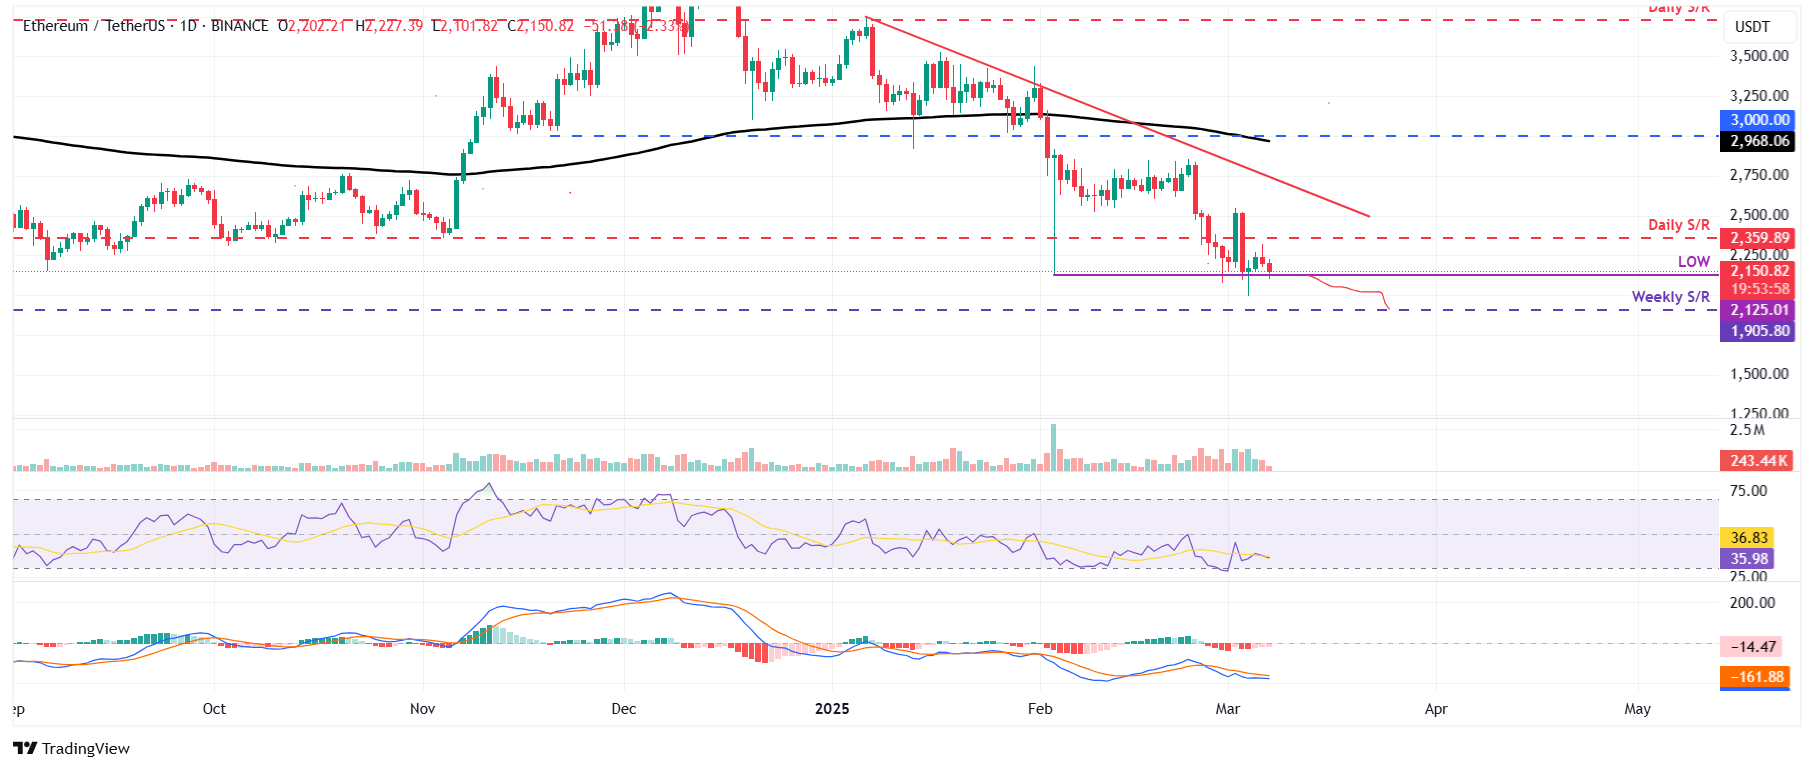
ETH/USDT daily chart
On the other hand, if the $2,125 level holds as support and ETH continues its recovery, it could extend the rally to retest its next resistance level at $3,000.
Ripple is poised for a recovery after finding support around the 100-day EMA
Ripple price was rejected around its key psychological level of $3 on Sunday, and it declined 18.79% the next day. However, it found support on Tuesday and bounced off its 100-day EMA at $2.31, recovering 8.63% until Thursday. At the time of writing on Friday, it declines slightly down around $2.48.
If the 100-day EMA at $2.31 holds, XRP could extend the recovery to retest its psychological level of $3. A firm close above this level could extend an additional rally to retest its January 16 high of $3.40.
The RSI on the daily chart reads 49 and remains flat around its neutral level of 50, indicating indecisiveness among traders. The RSI must move above its neutral level for the recovery to be sustained.
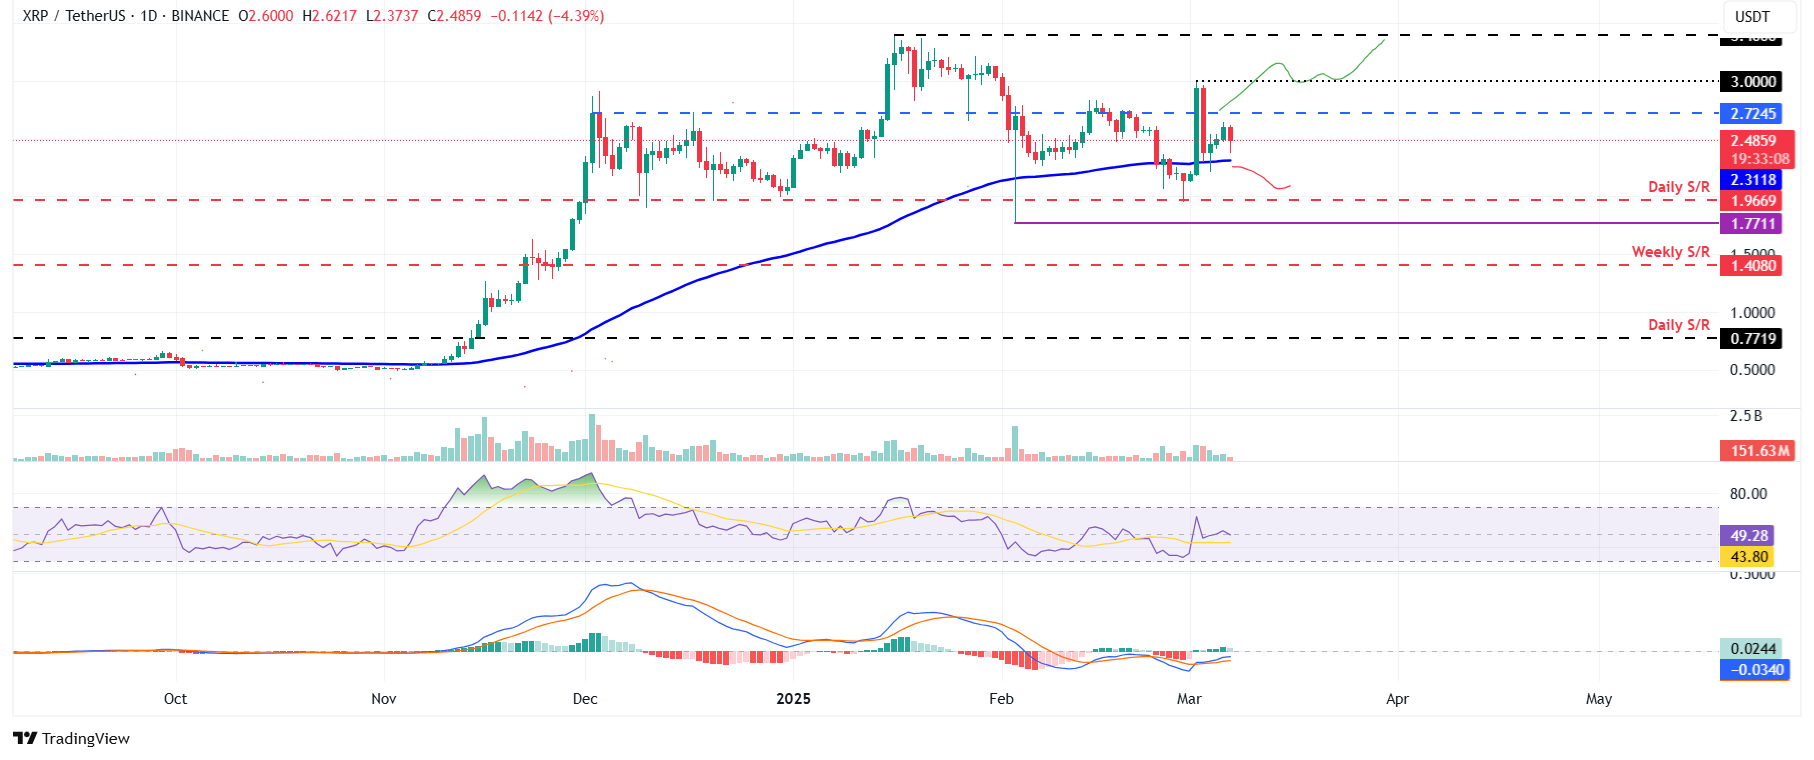
XRP/USDT daily chart
However, if XRP fails to find support at the 100-day EMA and closes below, it could extend the decline to retest its next support level at $1.96.
Read more
* The content presented above, whether from a third party or not, is considered as general advice only. This article should not be construed as containing investment advice, investment recommendations, an offer of or solicitation for any transactions in financial instruments.


