


Ethereum (ETH) has been struggling to regain bullish momentum after briefly turning positive amid the Solana meme coin controversy. While that initial push hinted at a stronger uptrend, it failed to gain traction, leaving ETH stuck in a consolidation phase.
Now, Ethereum is attempting to reclaim the $3,000 level as it recovers from a nearly 18% drop over the last 30 days. With technical indicators still showing mixed signals, ETH remains at a pivotal point where a decisive breakout or breakdown could shape its next major move.
ETH RSI Has Been Neutral For 16 Days
ETH RSI is currently at 54.8 after reaching a high of 62 and dropping to 39.1 between yesterday and today. This movement reflects a period of increased volatility, where price momentum briefly accelerated before pulling back.
Despite this fluctuation, RSI has now stabilized at a mid-range level, suggesting that neither strong buying nor selling pressure is currently dominant.
This comes after a series of neutral readings over the past few weeks, reinforcing the idea that ETH has been lacking a clear directional trend.
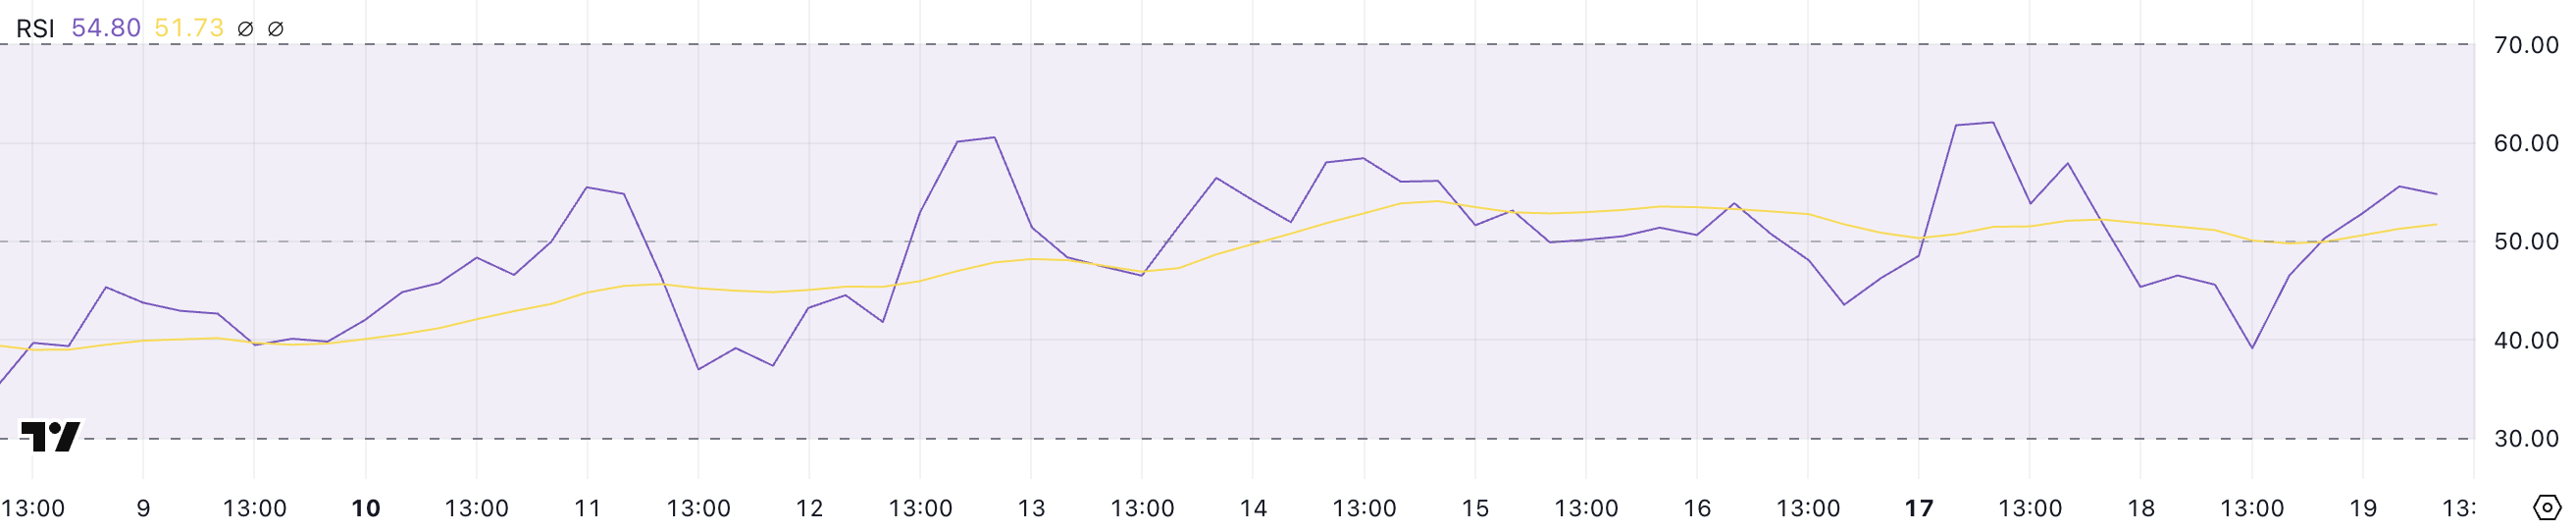 ETH RSI. Source: TradingView.
RSI, or the Relative Strength Index, is a momentum indicator that measures the speed and magnitude of recent price movements on a scale from 0 to 100.
Readings above 70 typically signal overbought conditions, which can indicate that an asset is due for a pullback, while readings below 30 suggest oversold conditions, often preceding a potential rebound. Ethereum RSI at 54.8 places it squarely in neutral territory, a position it has maintained since February 3.
The last time it reached overbought levels above 70 was on January 6 – nearly a month and a half ago – suggesting that ETH has struggled to generate the kind of sustained bullish momentum needed for a breakout.
Unless RSI moves decisively above 60 or below 40, ETH’s price is likely to remain range-bound without a strong directional bias.
Ethereum DMI Shows the Uptrend Is Still Trying to Get Traction
Ethereum’s DMI chart indicates that its ADX is currently at 10.2, declining from 13.7 yesterday and significantly down from 32.8 one week ago.
This sharp drop suggests a weakening trend strength, as ADX measures the overall momentum of a price movement rather than its direction.
A lower ADX reading typically signals that the market is in a period of consolidation or indecision, with neither bulls nor bears gaining clear control. Given that ADX has now fallen to a low level, ETH recent price action appears to lack strong conviction in either direction.
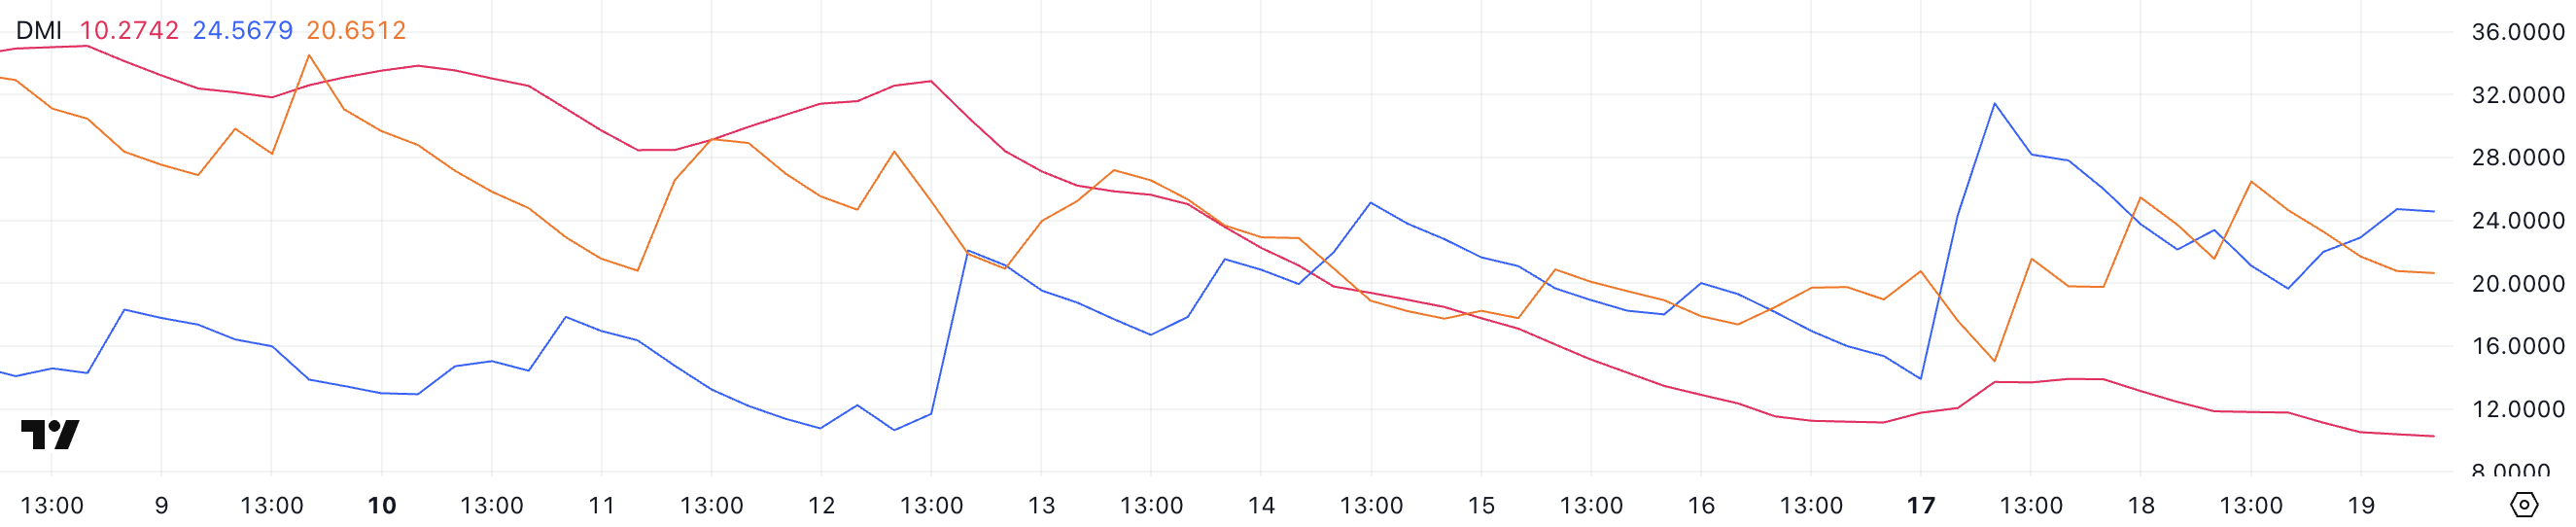 ETH DMI. Source: TradingView.
The Average Directional Index (ADX) is a key component of the Directional Movement Index (DMI) and is used to assess the strength of a trend on a scale from 0 to 100.
Readings above 25 indicate a strong trend, while values below 20 suggest weak or range-bound price action. Currently, Ethereum’s +DI sits at 24.5, down from 31.2 two days ago, reflecting waning bullish momentum following a brief rally that coincided with the Solana meme coin controversy.
Meanwhile, DI has risen to 20.6 from 15, indicating increasing bearish pressure. The combination of a falling ADX and converging DI lines suggests that Ethereum’s bullish momentum is fading. Without a renewed breakout in either direction, price action may continue to consolidate rather than trend decisively upward or downward.
Will Ethereum Fall Below $2,200?
Ethereum’s short-term EMA lines are currently very close to each other and still positioned below the long-term EMAs, signaling a lack of strong momentum in either direction.
If the price of Ethereum can establish a sustained uptrend, it could challenge the resistance at $3,020, marking the first time it trades above $3,000 since February 2.
A successful breakout above this level could open the door for further gains, with the next major resistance sitting at $3,442. However, the convergence of short-term EMAs suggests that ETH still needs stronger buying pressure to confirm a bullish shift.
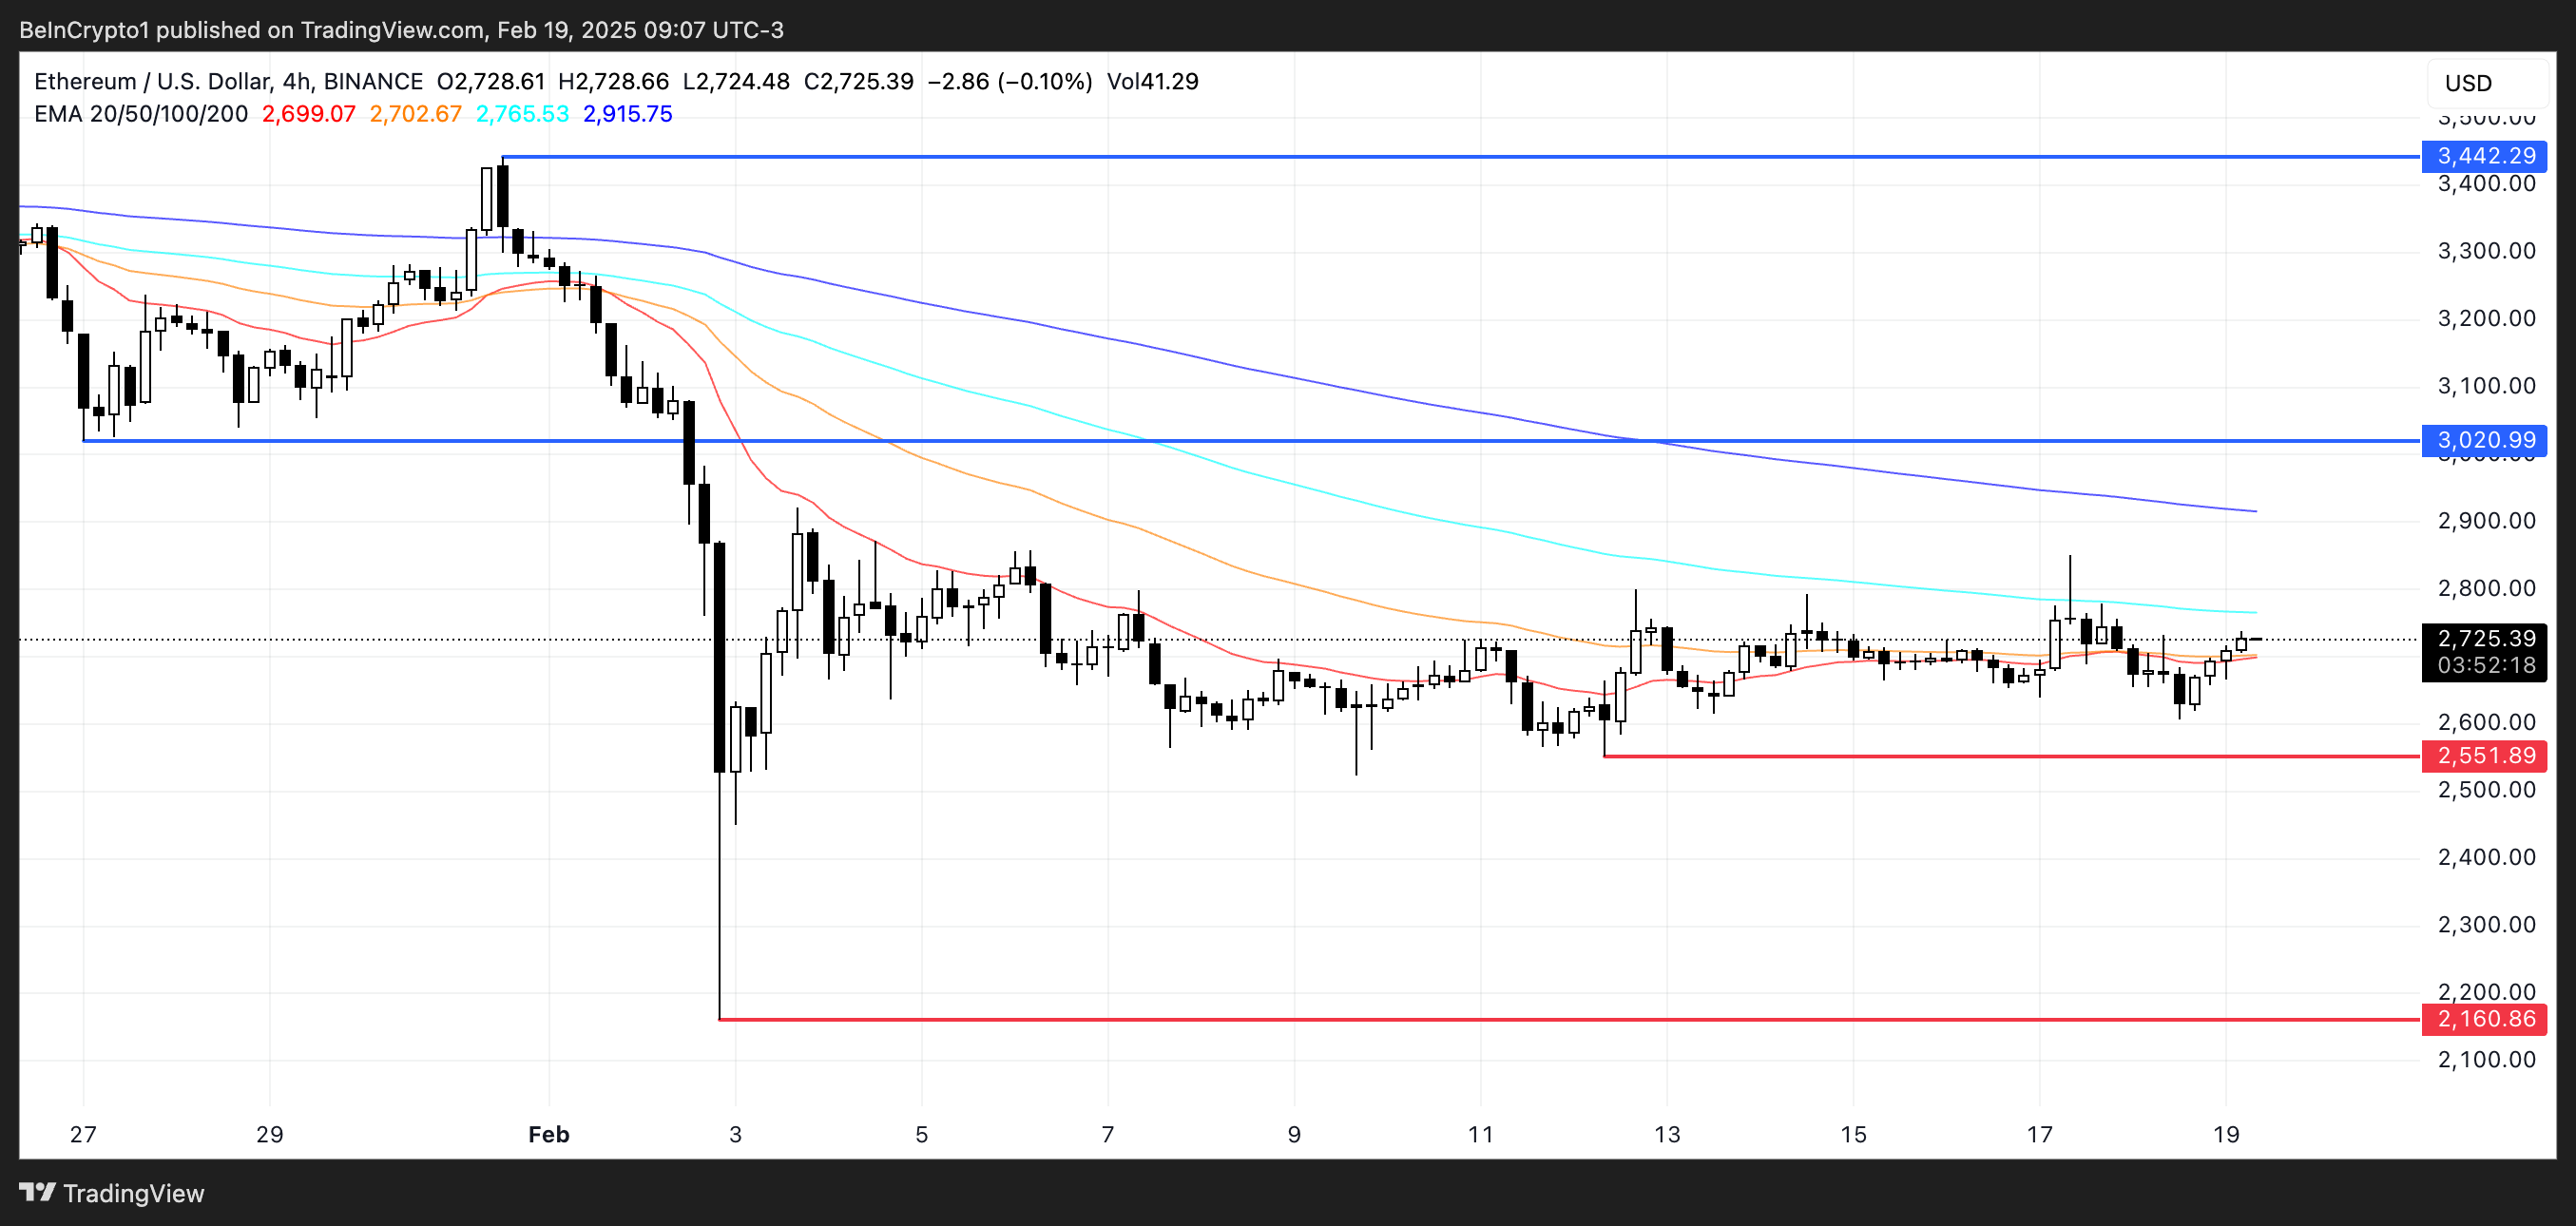 ETH Price Analysis. Source: TradingView.
On the downside, if Ethereum fails to build upward momentum and a downtrend emerges, it could test the key support level at $2,551.
A breakdown below this level would expose ETH to further losses, with the next critical support at $2,160. A move below $2,300 would be significant, as ETH has not traded at those levels since September 2024 – five months ago.
With EMAs still signaling indecision, ETH remains at a crossroads. A breakout in either direction is likely to set the next major trend.
* The content presented above, whether from a third party or not, is considered as general advice only. This article should not be construed as containing investment advice, investment recommendations, an offer of or solicitation for any transactions in financial instruments.


