

Top 3 Price Prediction Bitcoin, Ethereum, Ripple: BTC is on the verge of a breakout while ETH and XRP stabilize

- Bitcoin Drops to $70,000. U.S. Government Refuses to Bail Out Market, End of Bull Market or Golden Pit?
- Gold rallies further beyond $5,050 amid flight to safety, dovish Fed expectations
- Bitcoin Bottom Debate: $70,000 or $50,000?
- A Crash After a Surge: Why Silver Lost 40% in a Week?
- Bitcoin Slips Below 75,000 Mark. Will Strategy Change Its Mind and Sell?
- Bitcoin Rout. Bridgewater Founder Dalio Publicly Backs Gold.

Bitcoin price approaches its key resistance at $85,000 on Monday, with a breakout indicating a bullish trend ahead.
Ethereum price hovers around $1,600 after bouncing off from its daily support the previous week.
XRP's price stabilized at around $2.14 on Monday after finding support from its 200-day EMA last week.
Bitcoin (BTC) price approaches its key resistance level at $85,000 on Monday; a breakout indicates a bullish trend ahead. Ethereum (ETH) and Ripple (XRP) found support around their key levels last week, suggesting a recovery is in the cards.
Bitcoin could rally toward $90,000 if it breaks above its 200-day EMA
Bitcoin price broke and closed above its descending trendline (drawn by connecting multiple high levels since mid-January) on Friday and rallied 2.22% the next day. However, on Sunday, it faced rejection at the $85,000 level, which coincides with the 200-day Exponential Moving Average (EMA) and the daily resistance level. At the time of writing on Monday, it trades at around $84,000.
If BTC breaks and closes above $85,000, it could extend the rally to the key psychological level of $90,000. A successful close above this level could extend an additional rally to test its March 2 high of $95,000.
The Relative Strength Index (RSI) on the daily chart flattens around its neutral level of 50, indicating indecisiveness among traders. The RSI must move above its neutral level for the bullish momentum to be sustained.
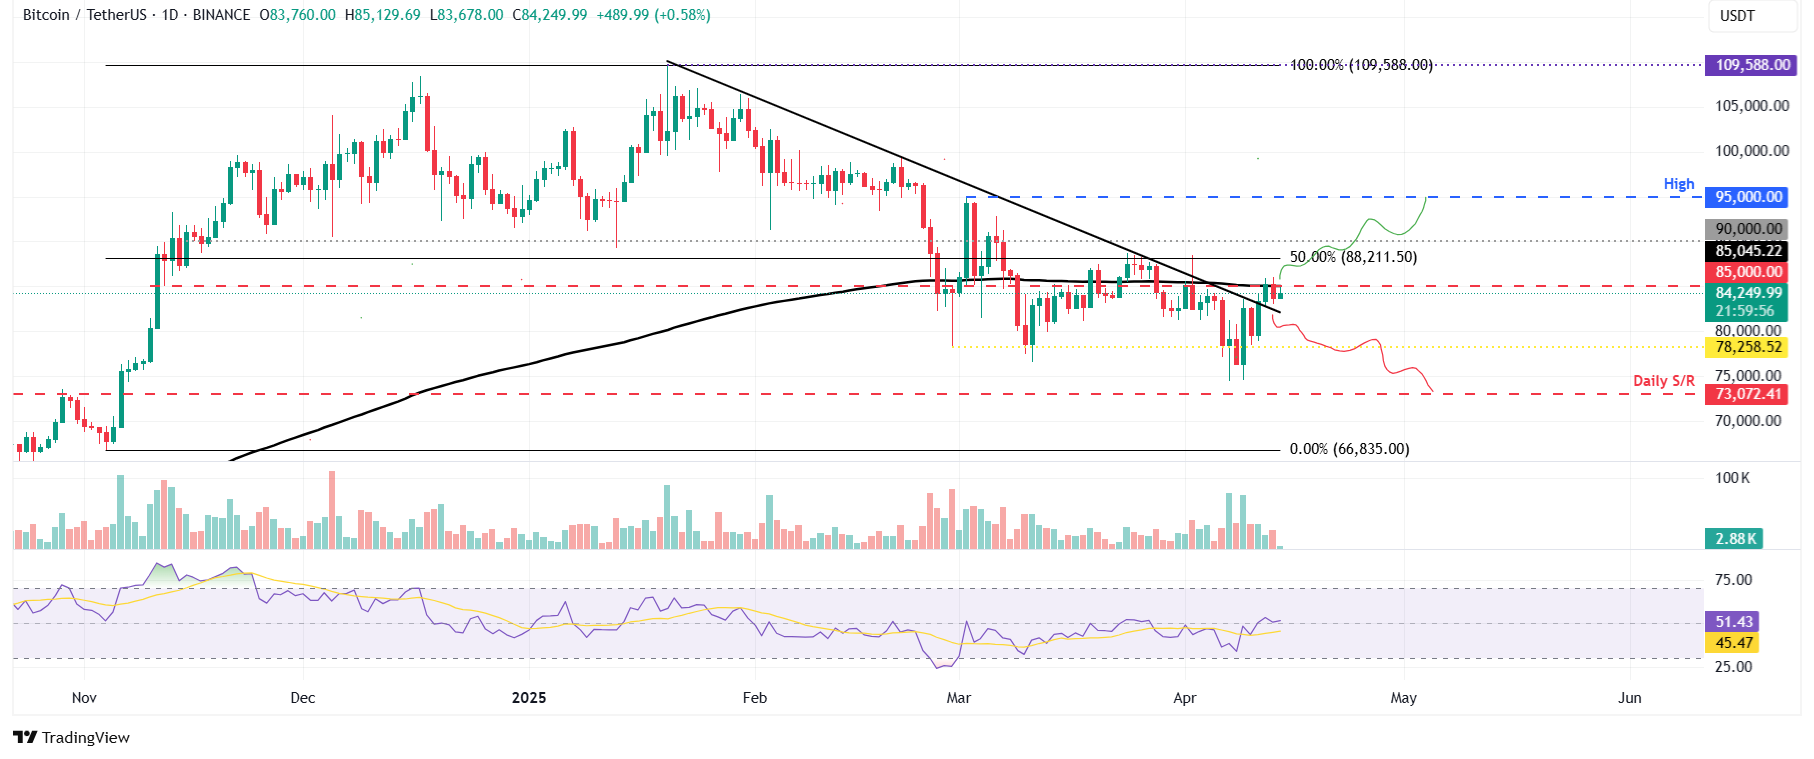
BTC/USDT daily chart
If BTC fails to close above $85,000 and continues its downward trend, it could extend the decline to retest its next daily support level at $73,072.
Ethereum price could recover if it closes above $1,700
Ethereum price found support around its daily level of $1,449 last week, recovered slightly, but faced resistance around $1,700. At the time of writing on Monday, it hovers at around $1,638.
If ETH continues its recovery and closes above $1,700, it could extend the rally to retest its next daily resistance at $1,861.
The RSI on the daily chart reads 42 after bouncing off its oversold level of 30 last week. It points upward toward its neutral level of 50, indicating fading bearish momentum. The RSI must move above its neutral level of 50 for the bullish momentum to be sustained.
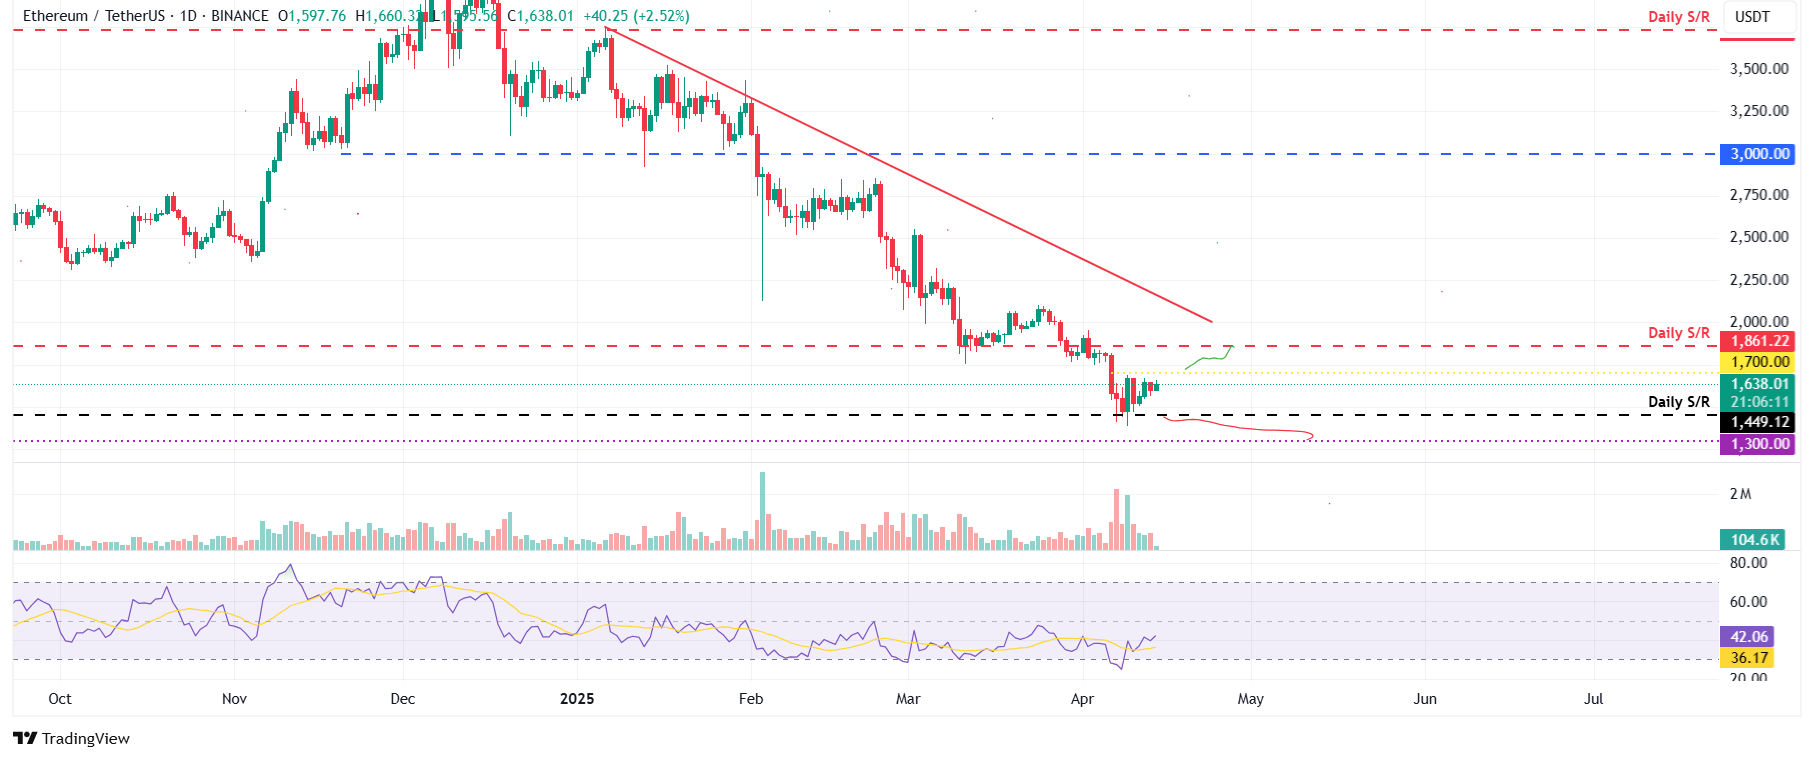
ETH/USDT daily chart
Conversely, if ETH closes below its daily support level of $1,449, it could extend the decline to retest its important psychological level of $1,300.
XRP bulls aiming for $2.50 mark
XRP price recovered by 14.28%, breaking above its 200-day EMA at $1.95 on Wednesday. It declined by 4.24% the next day, and the 200-day EMA level was tested. XRP continued its recovery and retested its April 2 high of $2.23 on Sunday. At the time of writing on Monday, it stabilizes at around $2.14.
If XRP breaks and closes above $2.23, it could extend the rally to retest its March 24 high of $2.50.
The RSI on the daily chart reads 50 and points upward toward its neutral level of 50, indicating the bearish momentum is fading. The RSI must maintain its level above 50 for the recovery rally to be sustained.
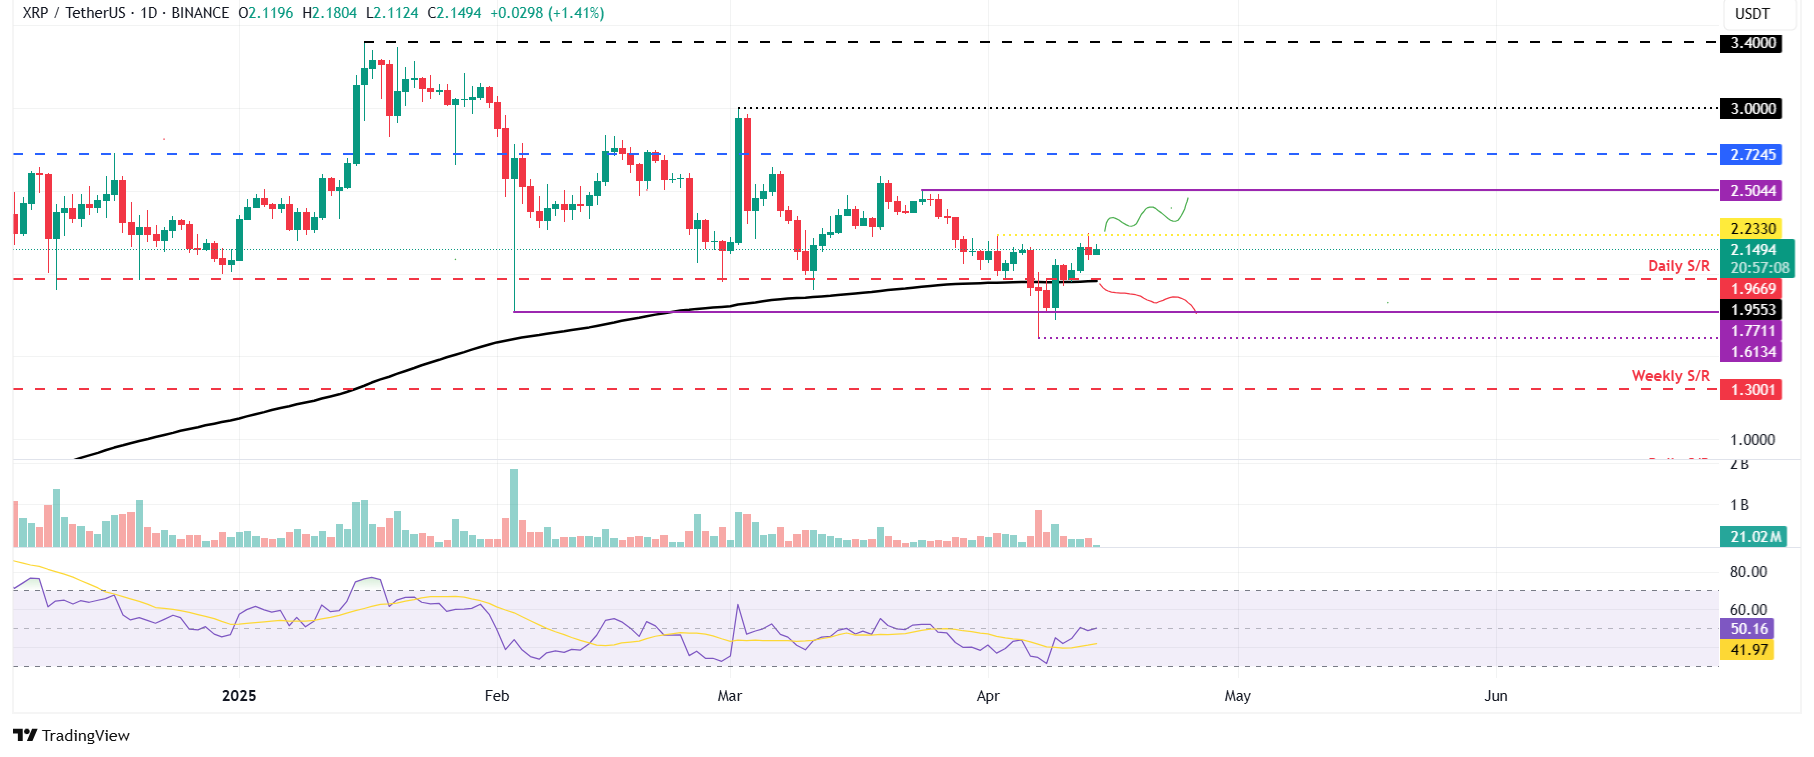
XRP/USDT daily chart
On the other hand, if XRP closes below its 200-day EMA, it could extend the decline to retest its next support level at $1.77.
Read more
* The content presented above, whether from a third party or not, is considered as general advice only. This article should not be construed as containing investment advice, investment recommendations, an offer of or solicitation for any transactions in financial instruments.


