
Top 3 Price Prediction Bitcoin, Ethereum, Ripple: BTC, ETH and XRP momentum indicators reflect weakness


Bitcoin price hovers around $82,000 on Monday after falling nearly 15% last week.
Ethereum price closes below the $2,125 support level, hinting at a further correction.
XRP trades around $2.17 on Monday after crashing 27.25% last week.
Bitcoin (BTC) hovers around $82,000 on Monday after falling nearly 15% last week. Ethereum (ETH) and Ripple (XRP) followed BTC’s footsteps and crashed by nearly 20% and 28%, respectively, while their momentum indicators continue to show weakness, hinting at further correction.
Bitcoin price is poised for a downleg following close below 200-day EMA
Bitcoin price broke and closed below its 200-day Exponential Moving Average (EMA) level at $85,754 on Sunday, declining 6.37%. At the time of writing on Monday, it hovers at around $81,800.
If BTC continues its downward trend, it could extend the decline to test its February 28 low of $78,258. A successful close below this level would extend an additional decline to retest its next support level at $73,072.
The Relative Strength Index (RSI) on the daily chart reads 36, rejecting from its neutral level of 50 last week and indicating a bearish momentum. Moreover, the Moving Average Convergence Divergence (MACD) also shows a bearish crossover on Sunday, giving sell signals and suggesting a downward trend.
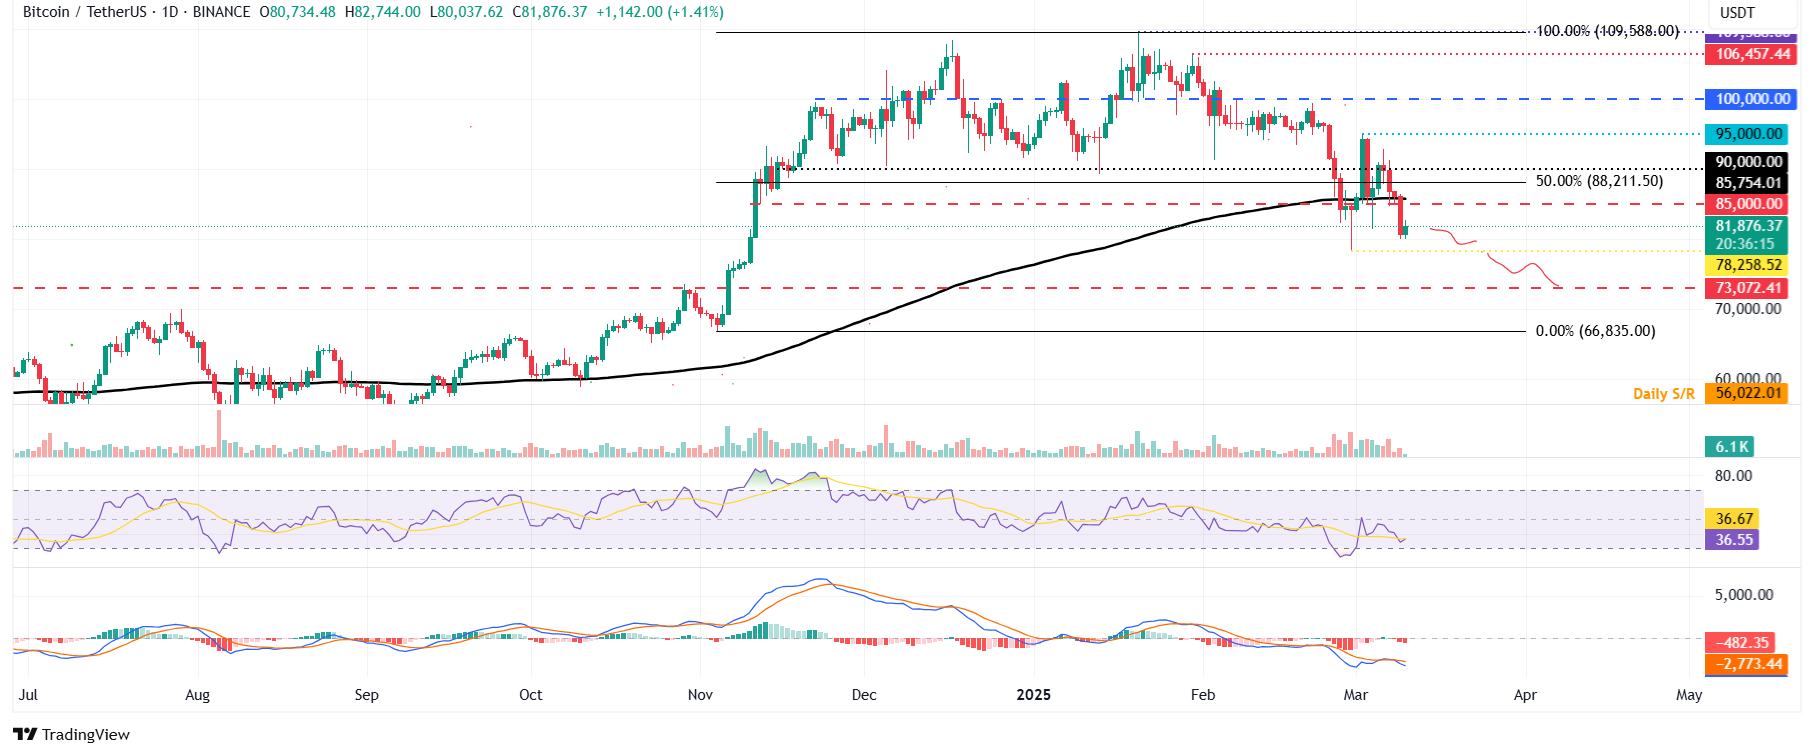
BTC/USDT daily chart
However, if BTC recovers, it could extend the recovery to $85,000.
Ethereum price momentum indicator display weakness
Ethereum price closed below the $2,125 support level on Sunday after declining nearly 20% last week. At the start of this week, on Monday, it trades at around $2,051.
If ETH continues its downward momentum, it could extend the decline to retest its weekly support level at $1,905.
The RSI on the daily chart reads 35 after rejecting around its neutral level of 50 last week, indicating bearish momentum. At the same time, its MACD also showed a bearish crossover last week, suggesting a continuation of a downward trend.
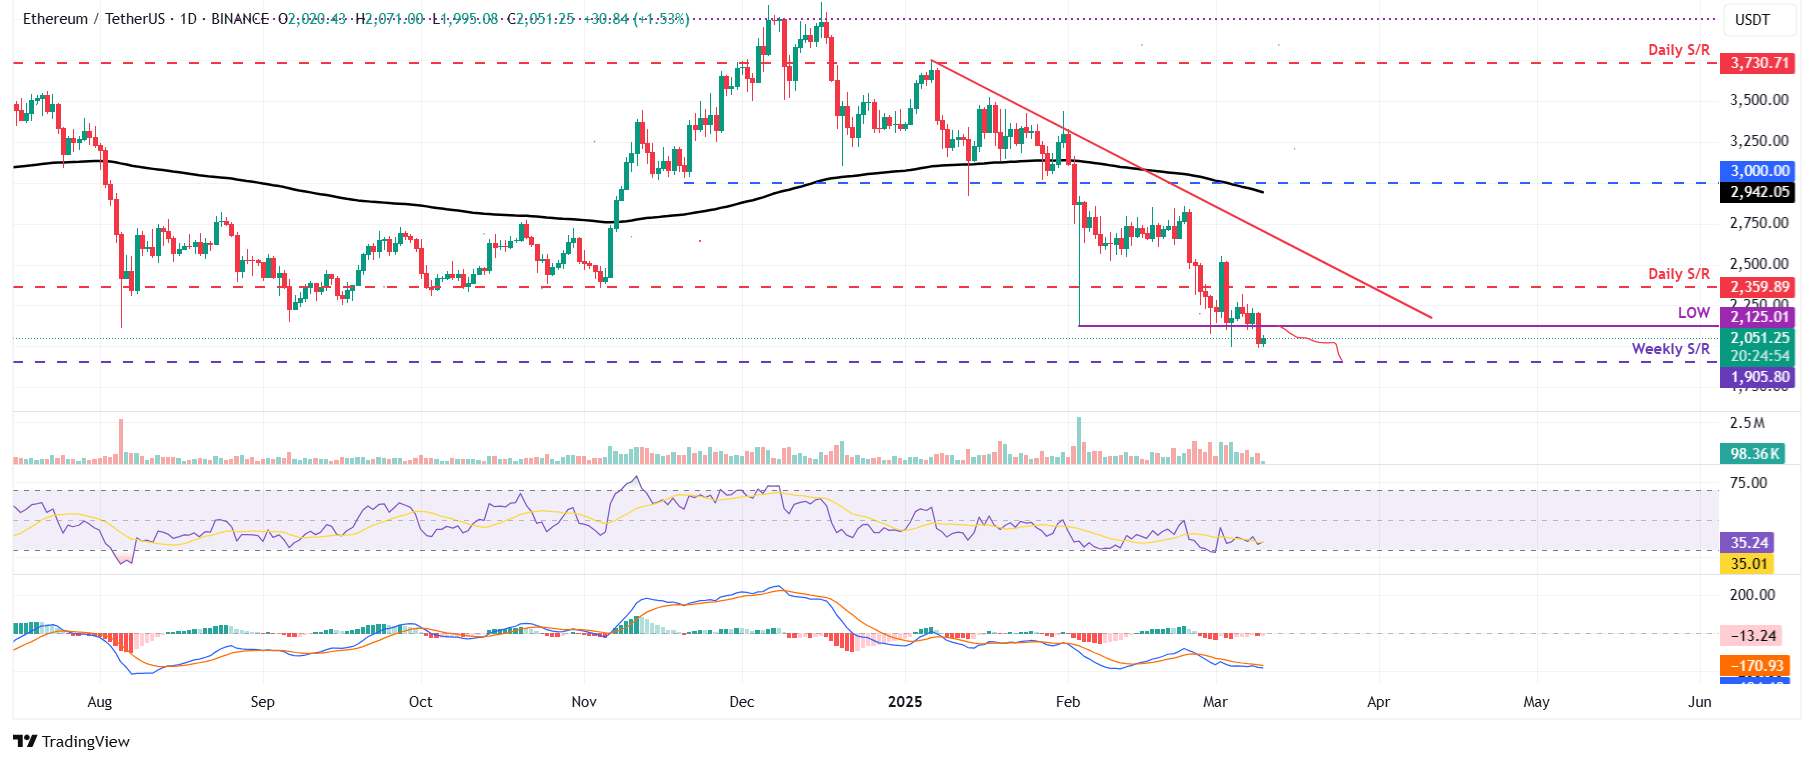
ETH/USDT daily chart
On the other hand, if the ETH recovers and closes above the $2,125 level, it could extend the recovery to retest its next resistance level at $2,359.
Ripple bears flaunt strength
Ripple price was rejected around its key psychological level of $3 on March 3 and declined 27% until Sunday. At the time of writing on Monday, it trades at around $2.17.
If XRP continues its correction, it could extend the decline to retest its daily support level at $1.96. A successful close below this level would extend an additional decline to test its February 3 low of $1.77.
The RSI reads 42, below its neutral level of 50, indicating a bearish momentum. The MACD also shows a bearish crossover on Sunday, giving sell signals and suggesting a downward trend.
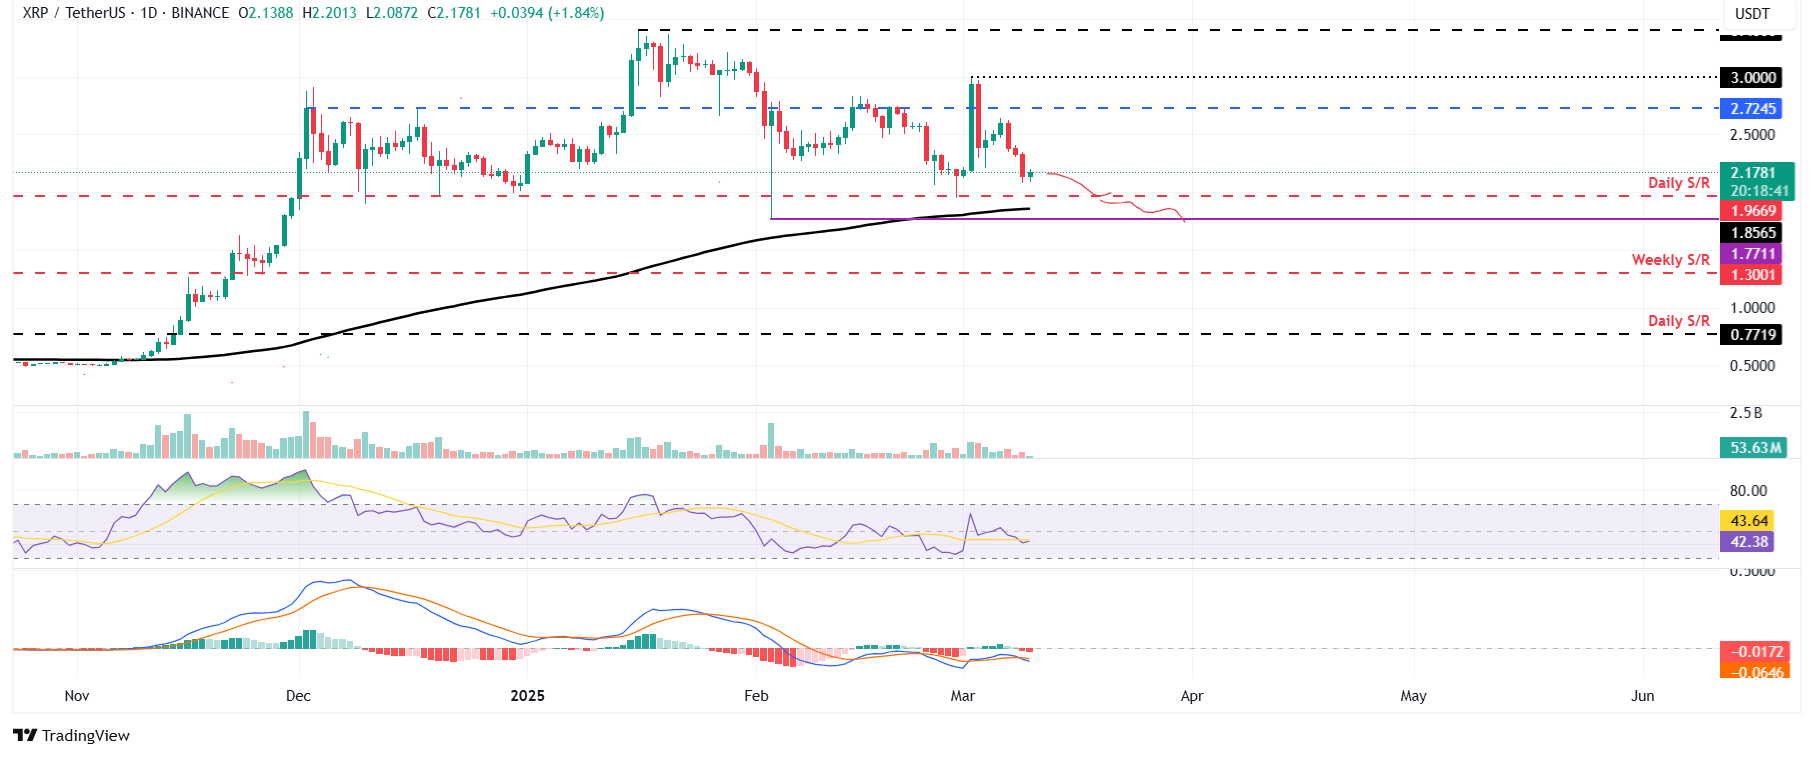
XRP/USDT daily chart
However, if XRP recovers, it could extend the recovery to test its next resistance level at $2.72.
* The content presented above, whether from a third party or not, is considered as general advice only. This article should not be construed as containing investment advice, investment recommendations, an offer of or solicitation for any transactions in financial instruments.


