

Top 3 Price Prediction Bitcoin, Ethereum, Ripple: BTC, ETH and XRP crash after major consolidation

- Bitcoin Drops to $70,000. U.S. Government Refuses to Bail Out Market, End of Bull Market or Golden Pit?
- Gold rallies further beyond $5,050 amid flight to safety, dovish Fed expectations
- Bitcoin Bottom Debate: $70,000 or $50,000?
- A Crash After a Surge: Why Silver Lost 40% in a Week?
- Bitcoin Slips Below 75,000 Mark. Will Strategy Change Its Mind and Sell?
- Bitcoin Rout. Bridgewater Founder Dalio Publicly Backs Gold.

Bitcoin price hovers around $88,500 on Wednesday after reaching a low of $86,050 the previous day.
Ethereum price retested its daily support level of $2,359; a firm close below would continue its downward trend.
XRP is trading around $2.28 on Wednesday after correcting 11% so far this week.
Bitcoin (BTC) price hovers around $88,500 on Wednesday after breaking out of its prolonged consolidation phase and reaching a low of $86,050 earlier this week. Ethereum (ETH) and Ripple (XRP) followed BTC’s footsteps and declined by nearly 11% and 12%, respectively.
Bitcoin bears aiming for $85,000 level
Bitcoin price broke out of its prolonged consolidation phase on Monday, slipping below the $94,000 support level and closing at $91,552 after a 4.89% decline. BTC continued its correction by 3.14% on Tuesday, reaching a low of $86,050. At the time of writing on Wednesday, it hovers around $88,500 level.
If BTC continues its pullback, it could extend the decline to test its next support level at $85,000.
The daily chart’s Relative Strength Index (RSI) reads 29, pointing downwards and below its oversold levels, indicating significant selling pressure and may be due for a potential reversal or bounce. However, traders should be cautious as the RSI may remain below its oversold levels and continue its correction.
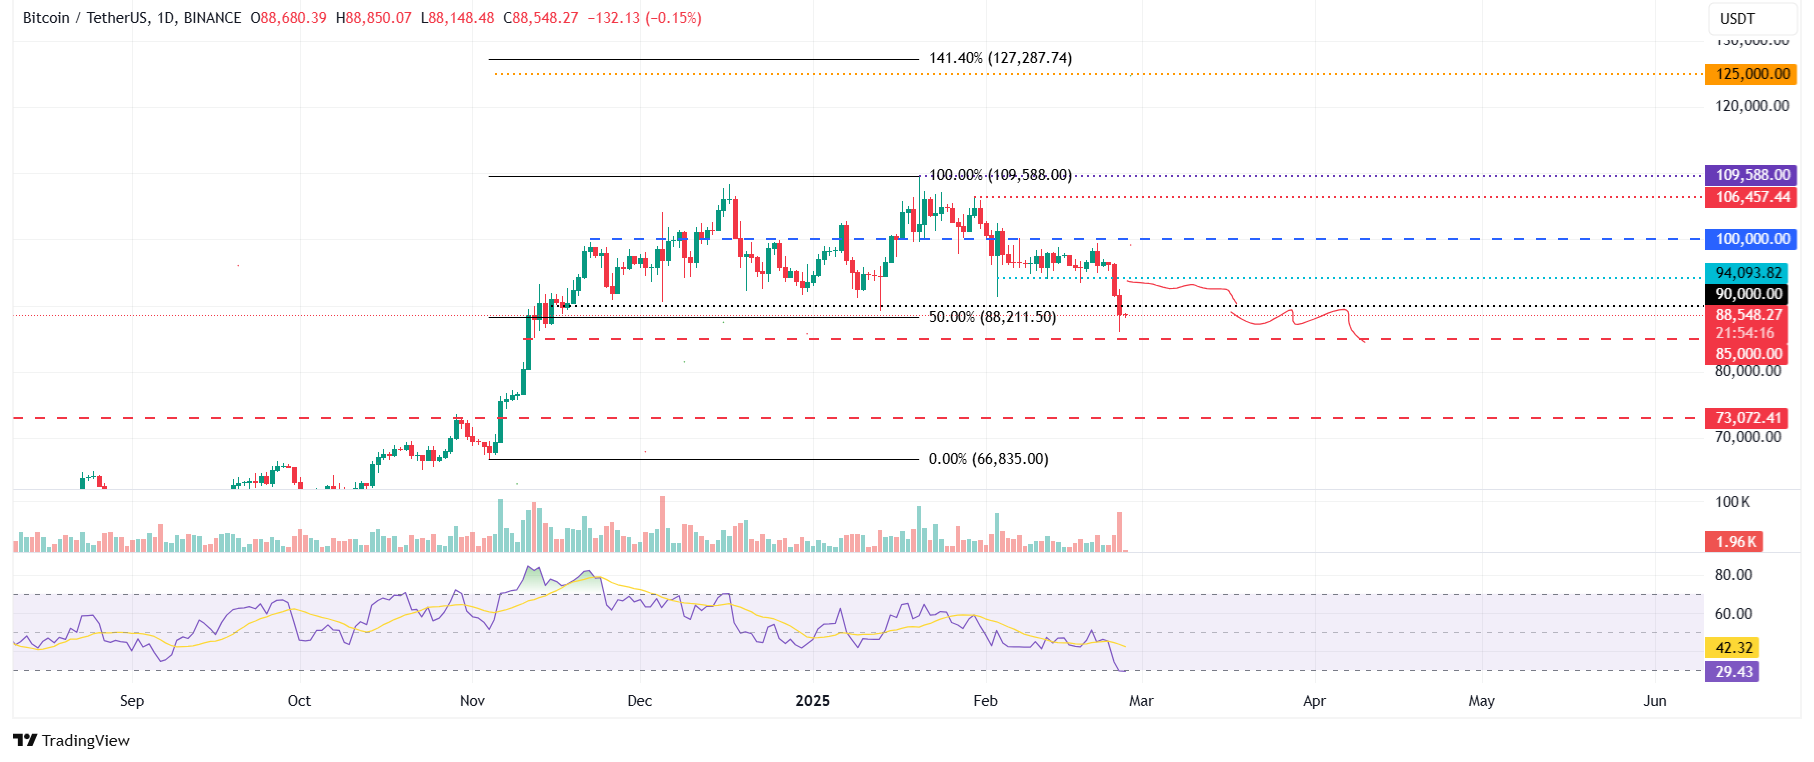
BTC/USDT daily chart
However, if BTC recovers, it could extend the recovery to retest its $100,000 psychological level.
Ethereum is poised for a downleg if it closes below the $2,359 level
Ethereum price declined almost 11% on Monday. It continued its downtrend the next day and retested its daily support level at $2,359. At the time of writing on Wednesday, it hovers around $2,486 level.
If ETH continues its downtrend and closes below $2,359, it could extend the decline to retest its February 3 low of $2,125.
The RSI on the daily chart reads 36, facing rejection from its neutral level of 50 on Sunday and points downwards, indicating a bearish momentum.
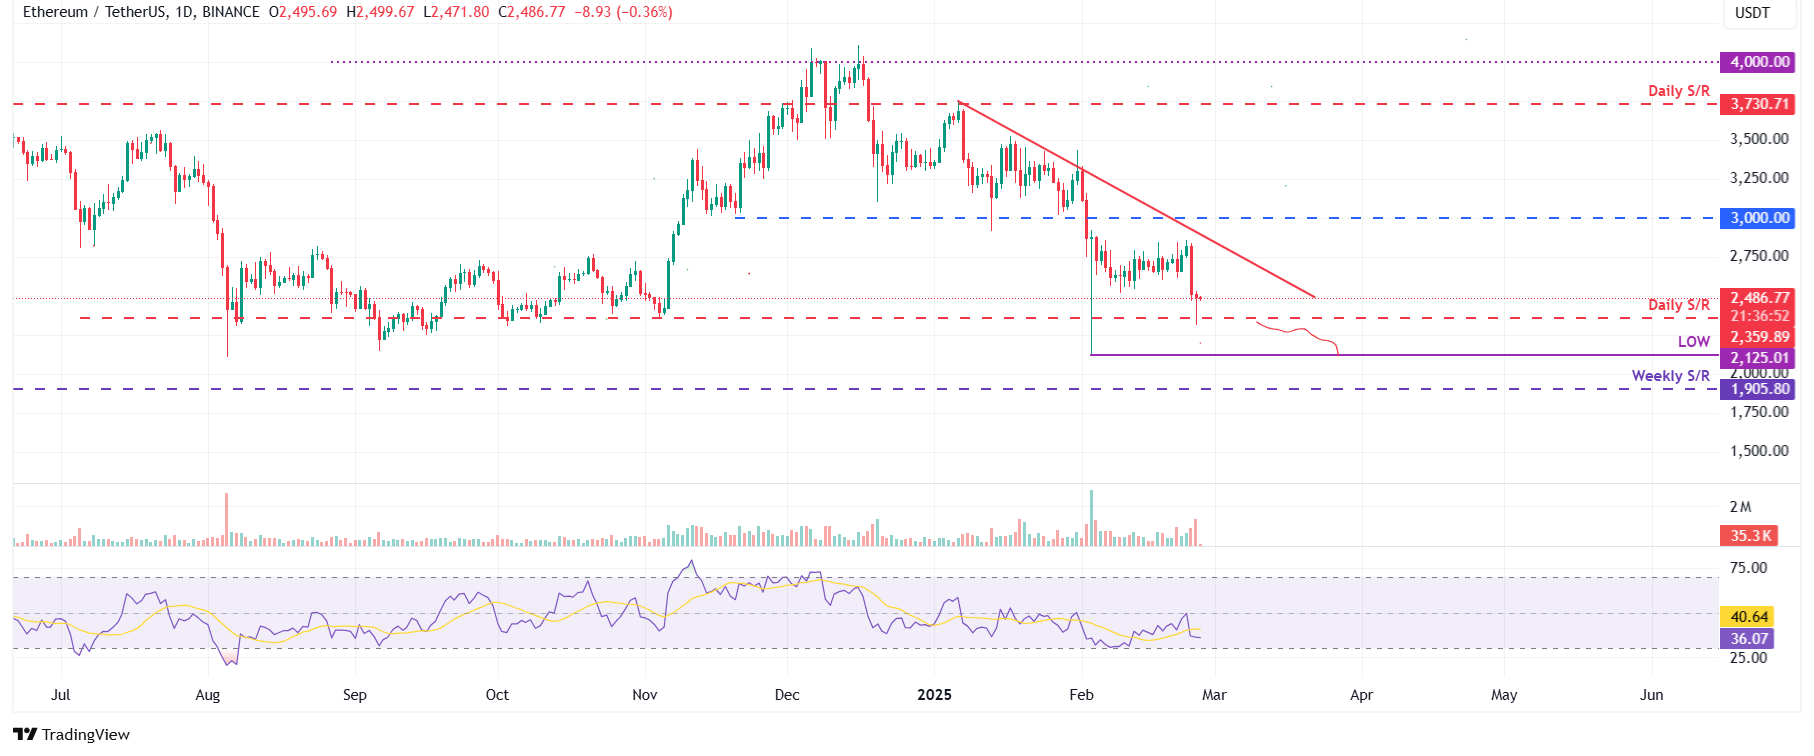
ETH/USDT daily chart
On the other hand, if ETH recovers, it could extend the recovery to test its Monday high of $2,839.
Ripple price RSI reflects weakness in momentum
Ripple price declined nearly 12% on Monday and reached a daily low of $2.06 the next day. At the time of writing on Wednesday, it hovers around $2.29 level.
If the daily level of $2.72 holds as resistance, it will extend the decline to test its next support level at $1.96.
The RSI on the daily chart reads 36, rejecting its neutral level of 50 and points downwards, indicating bearish momentum.
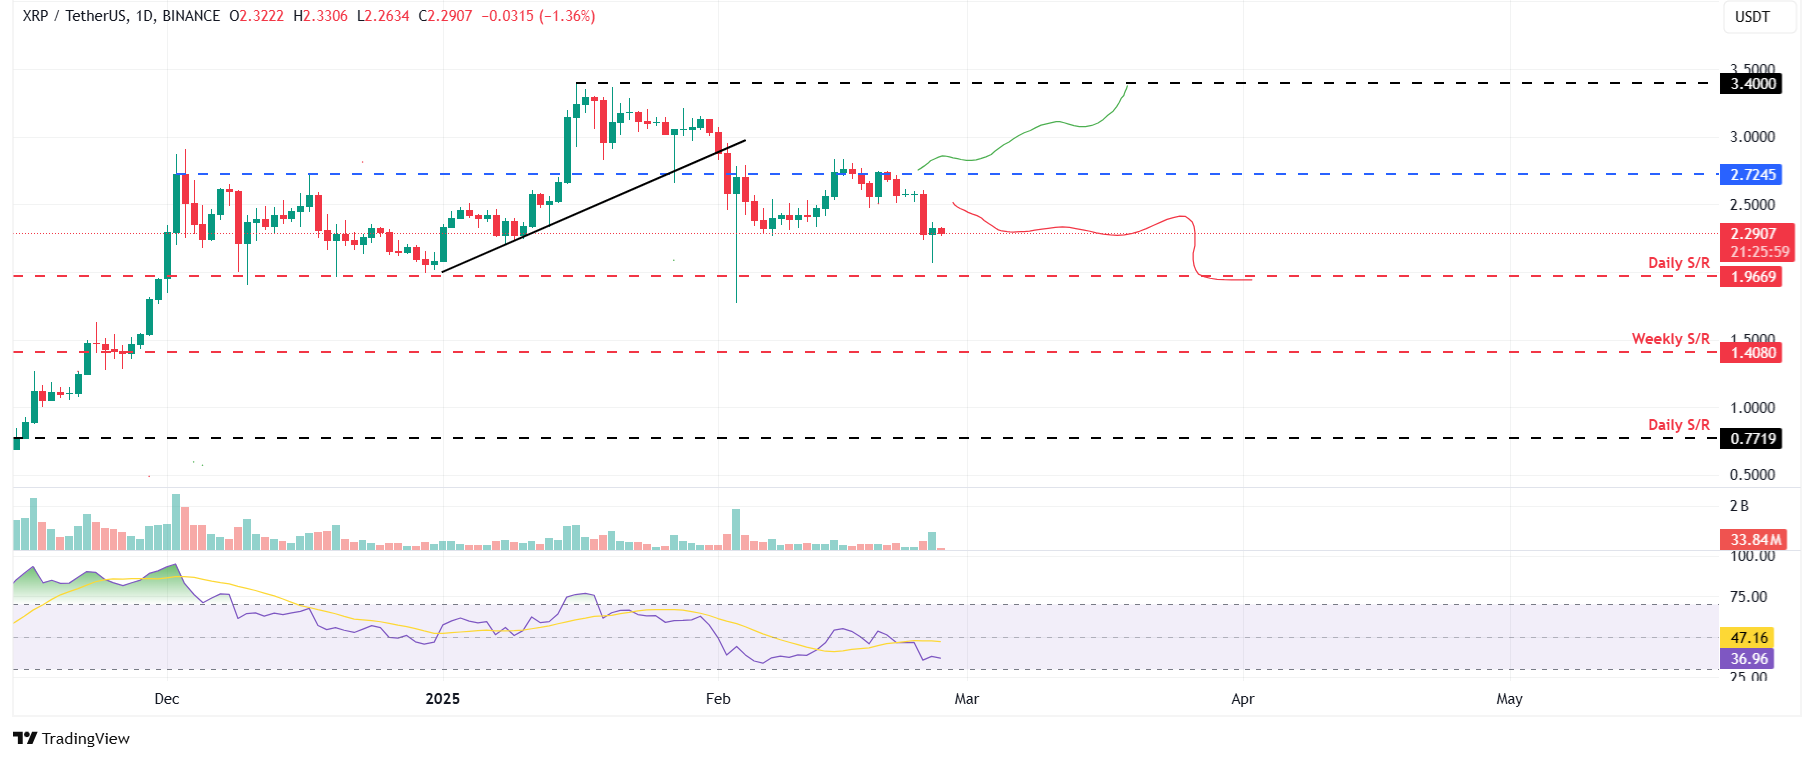
XRP/USDT daily chart
Conversely, if XRP closes above $2.72 and finds support, it will extend the rally and retest its January 16 high of $3.40.
Read more
* The content presented above, whether from a third party or not, is considered as general advice only. This article should not be construed as containing investment advice, investment recommendations, an offer of or solicitation for any transactions in financial instruments.


