

Top 3 Price Prediction Bitcoin, Ethereum, Ripple: BTC, ETH and XRP could decline on FTX repayments pressure

- Bitcoin Drops to $70,000. U.S. Government Refuses to Bail Out Market, End of Bull Market or Golden Pit?
- Gold rallies further beyond $5,050 amid flight to safety, dovish Fed expectations
- Bitcoin Bottom Debate: $70,000 or $50,000?
- A Crash After a Surge: Why Silver Lost 40% in a Week?
- Bitcoin Slips Below 75,000 Mark. Will Strategy Change Its Mind and Sell?
- Bitcoin Rout. Bridgewater Founder Dalio Publicly Backs Gold.

Bitcoin price has been consolidating between $94,000 and $100,000 for two weeks.
Ethereum price is trading around $2,390 on Wednesday after a mild fall of 2.63% the previous day.
XRP is extending its decline on Wednesday after facing resistance around the $2.72 level earlier this week.
Bitcoin (BTC) price has been consolidating between $94,000 and $100,000 for two weeks. Ethereum (ETH) and Ripple (XRP) faced a pullback earlier this week. BTC, ETH and XRP prices could decline further as FTX repayments could raise selling pressure.
According to Arkham data, the bankrupt exchange starts its repayments on Tuesday. Users with FTX claims of under $50,000 have started to receive funds through distribution providers Kraken and Bitgo. This wave of creditors represents approximately $1.2 billion in value.
Bitcoin stalemate could come to an end soon
Bitcoin price broke below the $100,000 support level on February 4 and has been consolidating between $94,000 and $100,000 since then. On Tuesday, BTC declined and found support around its lower boundary of the consolidating range. At the time of writing on Wednesday, it hovers around $95,700.
If BTC breaks and closes below the lower boundary of the consolidating range of $94,000, it could extend the decline to test its psychologically important level of $90,000.
The Relative Strength Index (RSI) on the daily chart reads 42, consolidating after being rejected at its neutral level of 50 last week and indicating slightly bearish momentum. Moreover, the Moving Average Convergence Divergence (MACD) showed a bearish crossover and red histogram bars, hinting at further correction.
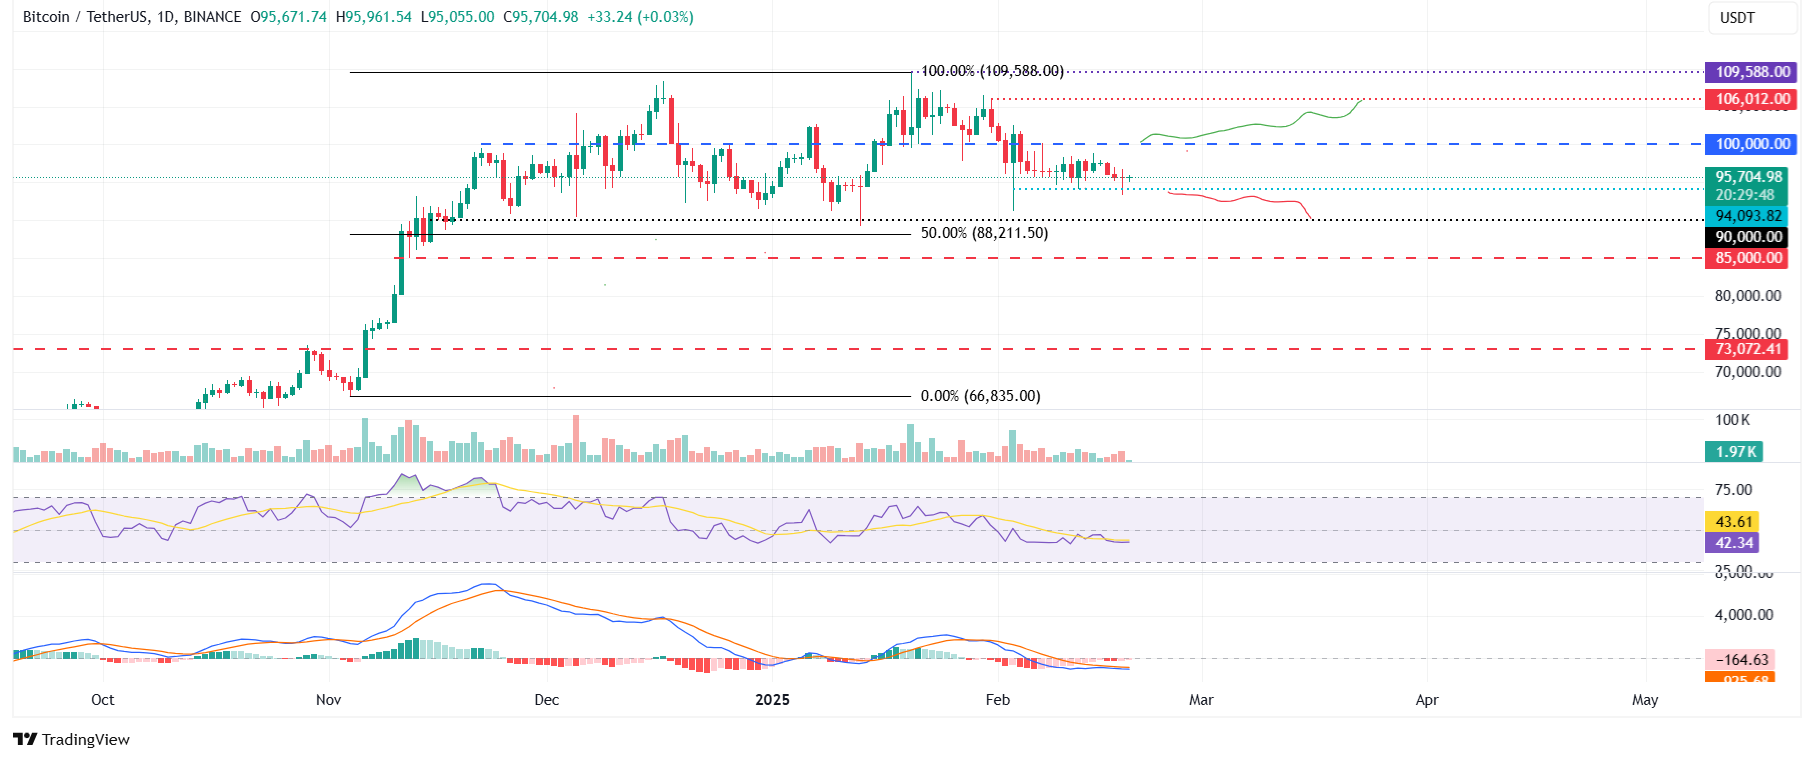
BTC/USDT daily chart
However, if BTC recovers and breaks above the upper boundary of the consolidating range of $100,000, it would extend the recovery to retest its January 31 high of $106,012.
Ethereum momentum indicators show signs of strength
Ethereum price faced a rejection around its descending trendline on February 1 and declined 13.87%, closing below its $3,000 psychologically important level the next day. ETH continued its correction by nearly 9% in the following week. However, ETH prices recovered slightly by 1.3% the previous week. At the time of writing on Wednesday, it hovers around $2,690.
If ETH continues to recover, it could extend the recovery to test the $3,000 level.
The RSI on the daily chart reads 41, bounced off from its oversold level of 30 last week, indicating fewer signs of selling pressure. However, the RSI must trade above its neutral level of 50 to sustain the bullish momentum. Such a development would add a tailwind to the recovery rally. Moreover, the MACD indicator showed a bullish crossover on the daily chart last week, giving buy signals and indicating an upward trend ahead.
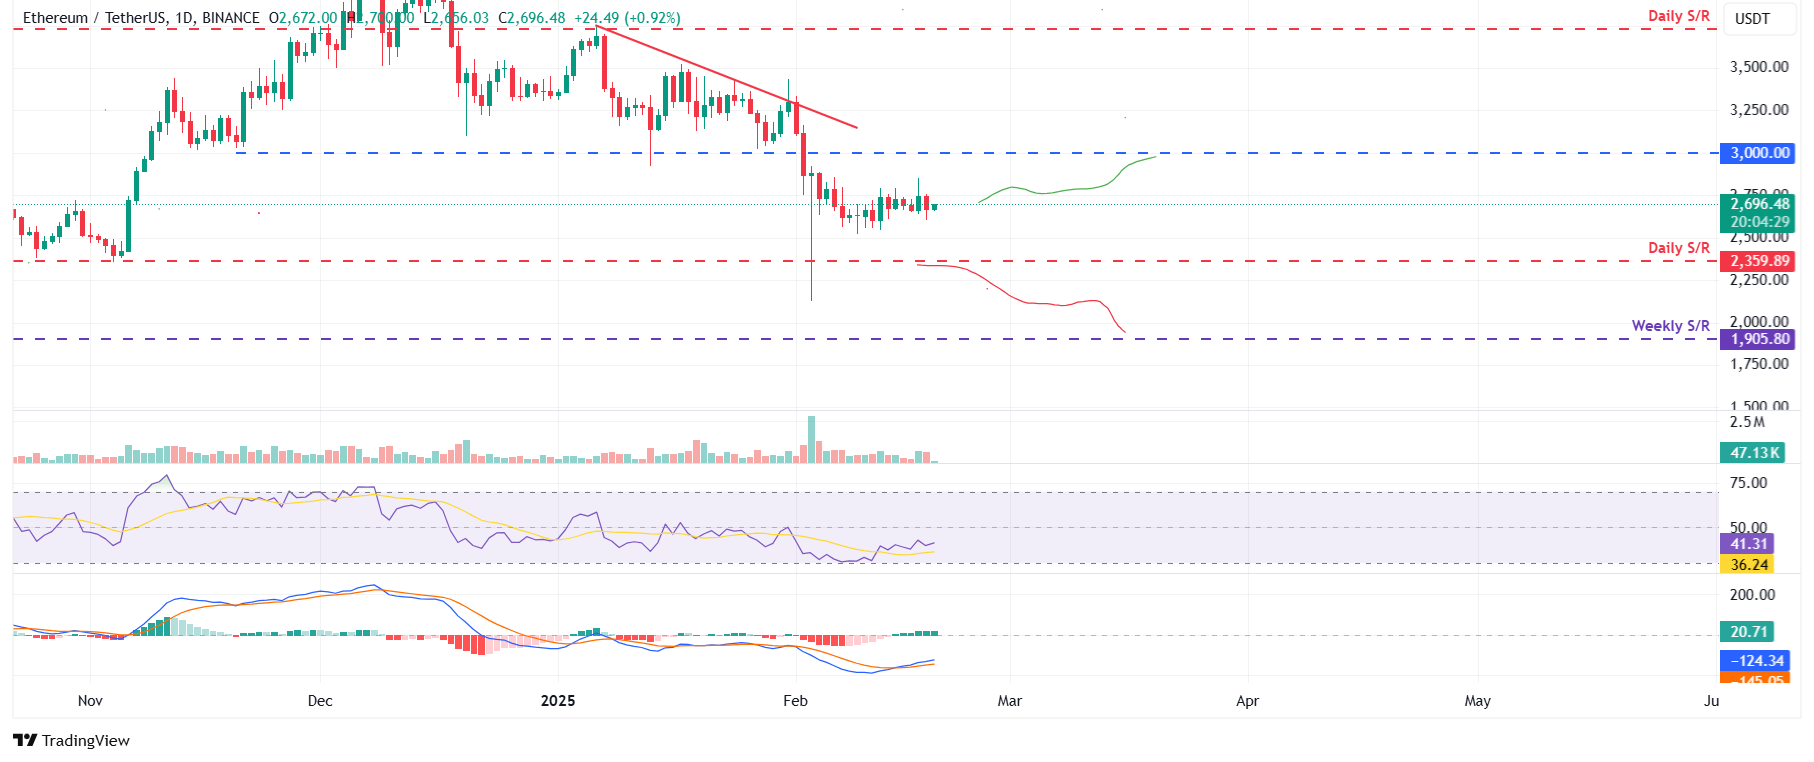
ETH/USDT daily chart
However, if ETH continues its decline and closes below $2,359, it will extend the decline to test its next weekly support at $1,905.
Ripple bears aim for $1.96 mark
Ripple price rallied 14% last week, breaking above the daily level of $2.72 on Friday and finding support around it on Sunday. However, XRP closed below its $2.72 support level on Monday and declined 6% until Tuesday. At the time of writing on Wednesday, it hovers around $2.55.
If the daily level of $2.72 holds as resistance, it will extend the decline to test its next support level at $1.96.
The RSI on the daily chart reads 45, below its neutral level of 50, indicating bearish momentum.
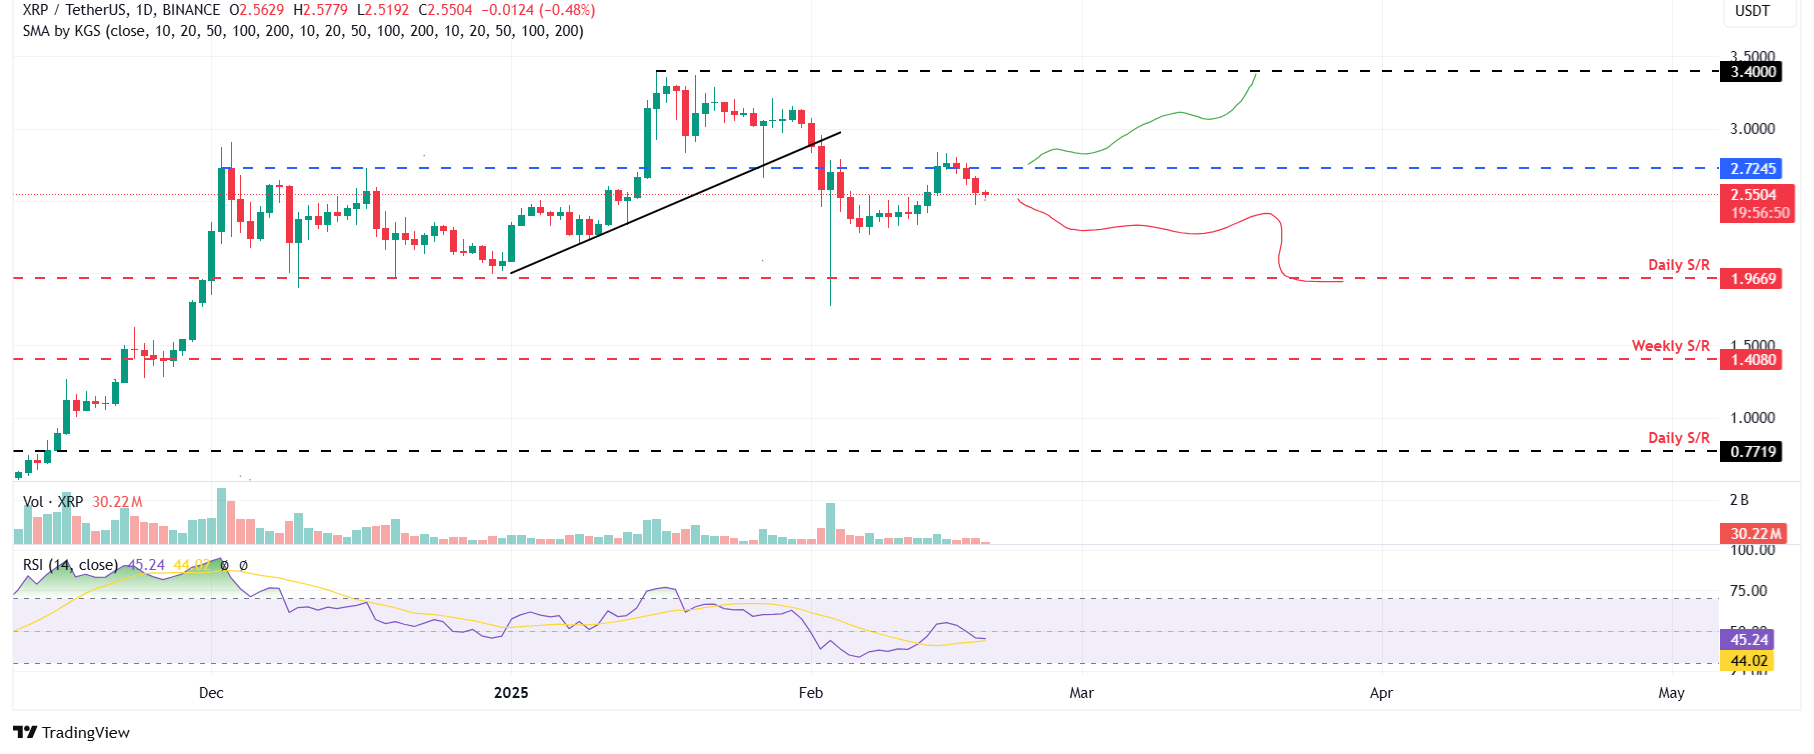
XRP/USDT daily chart
However, if XRP closes above $2.72 and finds support, it will extend the rally to retest its January 16 high of $3.40.
Read more
* The content presented above, whether from a third party or not, is considered as general advice only. This article should not be construed as containing investment advice, investment recommendations, an offer of or solicitation for any transactions in financial instruments.


