

Top 3 Price Prediction Bitcoin, Ethereum, Ripple: BTC, ETH and XRP show strength ahead of Trump’s inauguration

- Bitcoin Drops to $70,000. U.S. Government Refuses to Bail Out Market, End of Bull Market or Golden Pit?
- Gold rallies further beyond $5,050 amid flight to safety, dovish Fed expectations
- Bitcoin Bottom Debate: $70,000 or $50,000?
- A Crash After a Surge: Why Silver Lost 40% in a Week?
- Bitcoin Slips Below 75,000 Mark. Will Strategy Change Its Mind and Sell?
- Bitcoin Rout. Bridgewater Founder Dalio Publicly Backs Gold.

Bitcoin price continues to trade green on Friday after rallying almost 7% so far this week.
Ethereum price finds support around its 200-day EMA at $3,120, eyeing a recovery ahead.
Ripple price continues its rally on Friday after breaking above its symmetrical triangle pattern earlier this week.
Bitcoin’s (BTC) price continues to trade green, trading above $100,900 on Friday after rallying almost 7% so far this week. Ethereum (ETH) and Ripple (XRP) followed BTC’s footsteps and bounced after retesting key support levels earlier this week, all hinting at a rally ahead.
Bitcoin bulls aim for its all-time high of $108,353
Bitcoin price bounced after retesting its $90,000 support level on Monday and rose 5.77%, closing above the $100K in the next three days. At the time of writing on Friday, it continues to trade higher, around $100,900.
If BTC continues its upward momentum, it could extend the rally to retest the December 17, 2024, all-time high of $108,353.
The Relative Strength Index (RSI) indicator on the daily chart reads 59, above its neutral level of 50, and points upwards, indicating a rise in bullish momentum. Additionally, the Moving Average Convergence Divergence (MACD) indicator flipped a bullish crossover on Wednesday, giving a buy signal and suggesting an uptrend.
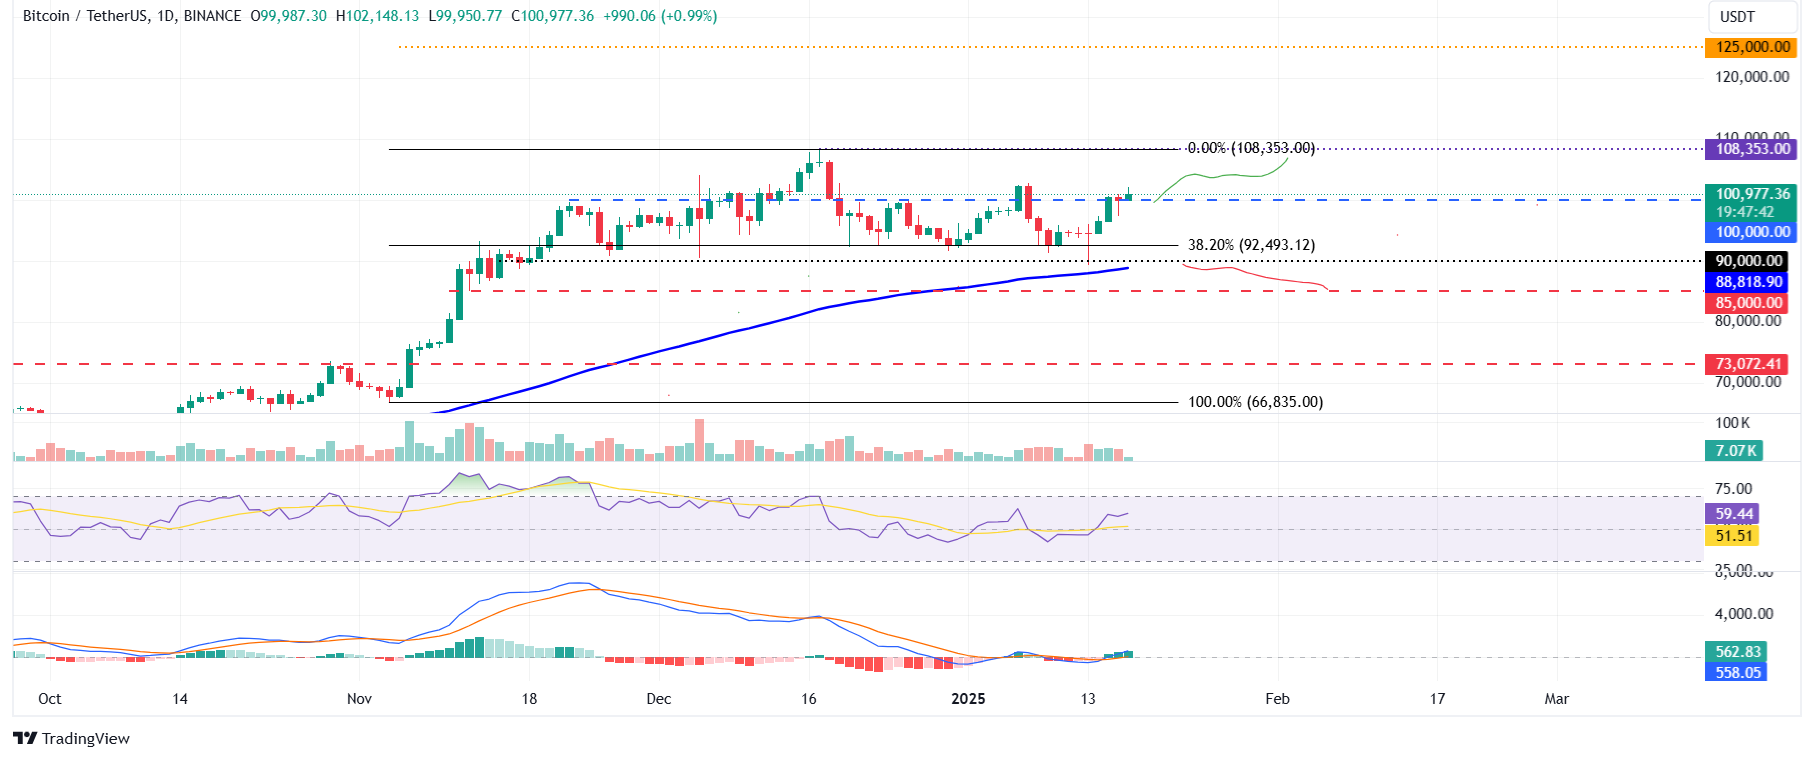
BTC/USDT daily chart
However, if BTC faces a pullback and closes below the $100,000 support level, it could extend the decline to retest its next support level at $90,000.
Ethereum rebound after retesting its 200-day EMA
Ethereum price rebounded and closed above its 200-day Exponential Moving Average (EMA) at $3,120 on Tuesday and rose 7.2% the next day. However, it declined 4% on Thursday, and at the time of writing on Friday, it hovers around $3,257.
If the $3,120 EMA level holds, ETH could extend the recovery to test its daily resistance level at $3,730.
However, the RSI indicator on the daily chart reads 48, below its neutral level of 50, but points upwards, indicating weakness in bearish momentum. Additionally, the Moving Average Convergence Divergence (MACD) indicator is about to flip a bullish crossover. If the MACD line closes above the signal line, it would give a buy signal and suggest an uptrend.
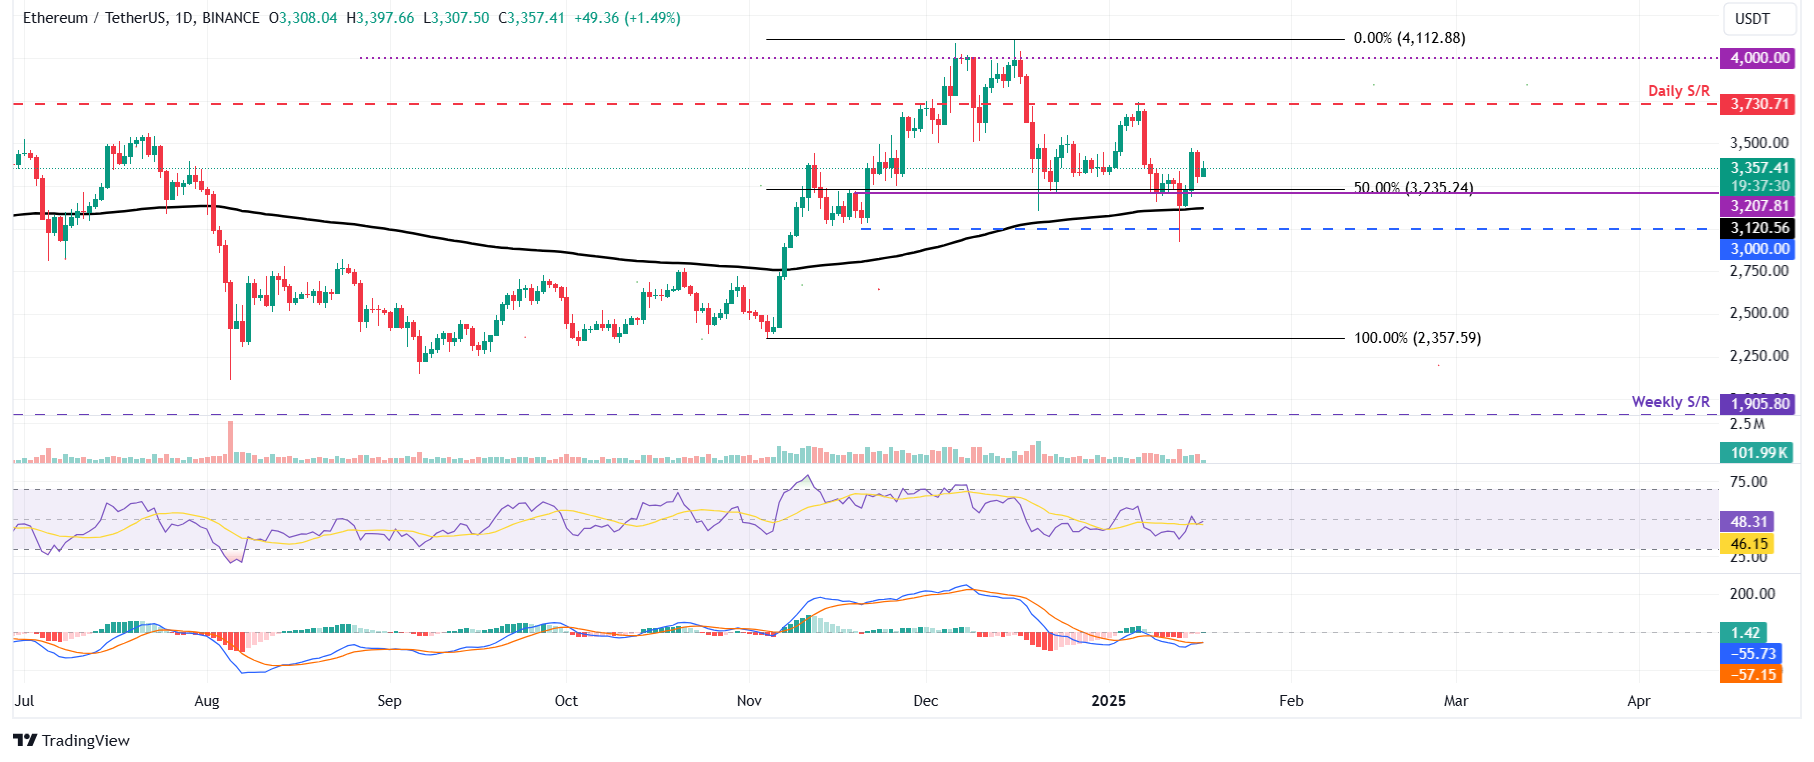
ETH/USDT daily chart
Conversely, if ETH closes below the 200-day EMA at $3,120, it could extend the decline to test its psychological importance level of $3,000.
Ripple bulls could aim for the symmetrical triangle target at $3.63
Ripple price retested its upper symmetrical triangle boundary on Monday and rallied 28.6%, closing above its psychological importance level of $3.00 over the next three days. At the time of writing on Friday, it continues to trade higher, around $3.29.
If XRP continues its upward momentum, it could extend the rally to test its technical target obtained by this pattern, which would be $3.63.
The RSI indicator reads 76, above its neutral value of 50, indicating bullish momentum. Additionally, the MACD shows a bullish crossover, suggesting a continuation of an upward trend.
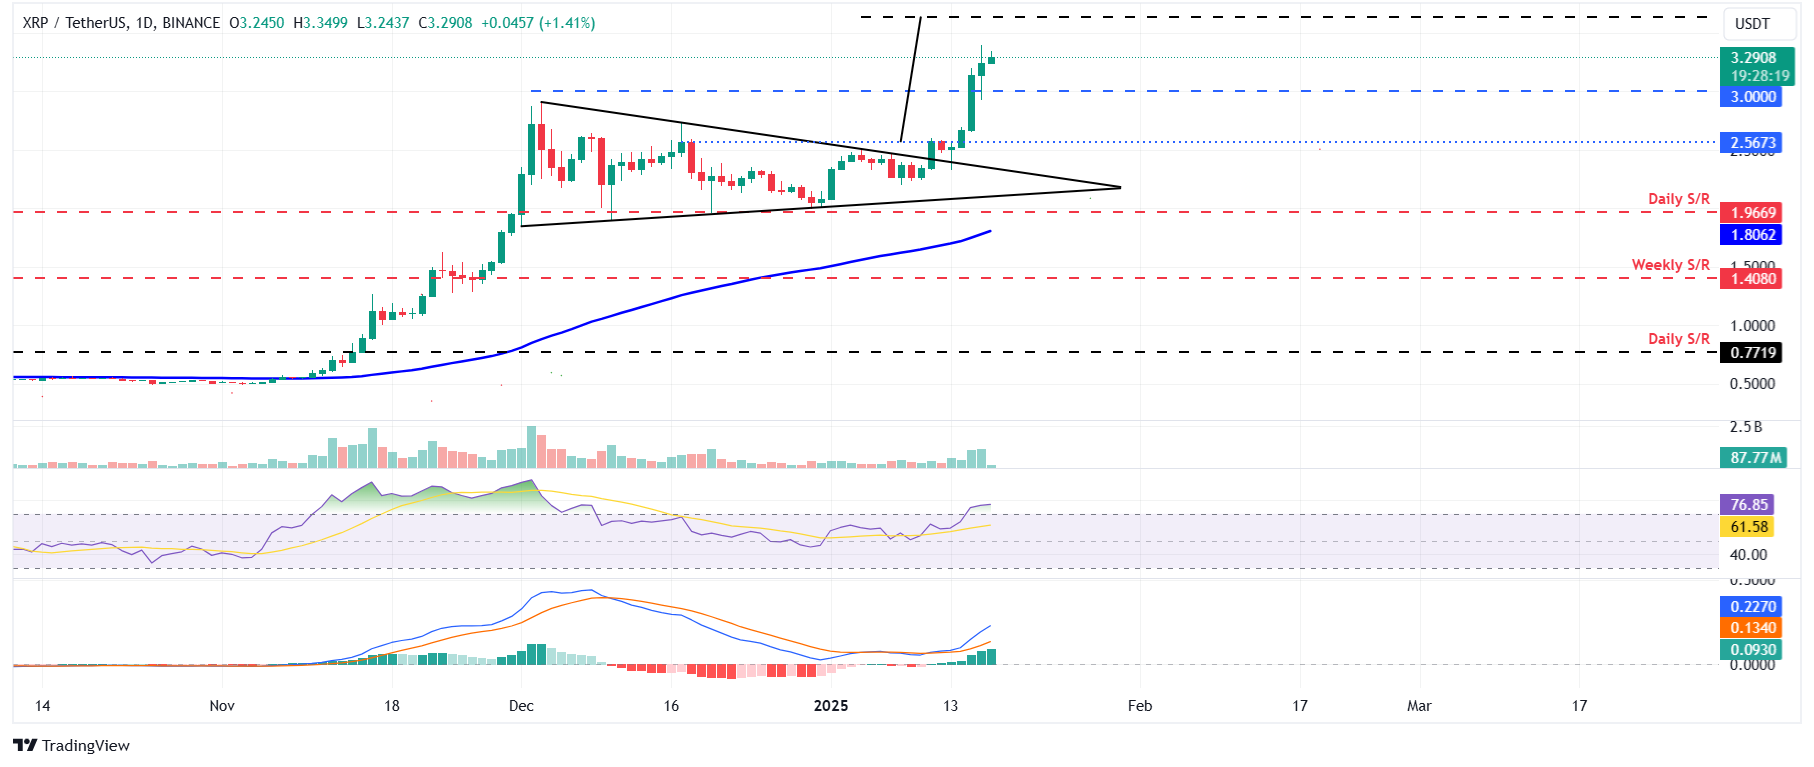
XRP/USDT daily chart
However, if XRP closes below the $1.96 daily support level, it would extend the decline to retest its next support level at $1.40.
Read more
* The content presented above, whether from a third party or not, is considered as general advice only. This article should not be construed as containing investment advice, investment recommendations, an offer of or solicitation for any transactions in financial instruments.


