
Top 3 Price Prediction Bitcoin, Ethereum, Ripple: BTC, ETH and XRP are headed for further drops


Bitcoin price continues to edge lower, trading below $96,000 on Monday.
Ethereum price fell below $2,600 after losing nearly 9% the previous week.
Ripple faced rejection around the $2.72 daily resistance; further correction on the cards.
Bitcoin's (BTC) price continues to edge down, trading below $96,000 on Monday after declining the previous week. Ethereum (ETH) and Ripple (XRP) prices followed BTC's footsteps, declined more than 7% the previous week, and traded below their key support level, hinting at further correction.
Bitcoin bears remain strong, heading toward the $90,000 mark
Bitcoin price faced rejection, closed below the $100,000 psychological level and declined nearly 2% in the previous week. At the time of writing on Monday, it continues to trade down around $95,800.
If BTC continues its correction, it could extend the decline to test its psychologically important level of $90,000.
The Relative Strength Index (RSI) on the daily chart reads 40 after being rejected from its neutral level of 50 last week, indicating bearish momentum.
Moreover, the Moving Average Convergence Divergence (MACD) showed a bearish crossover, hinting at further correction ahead.
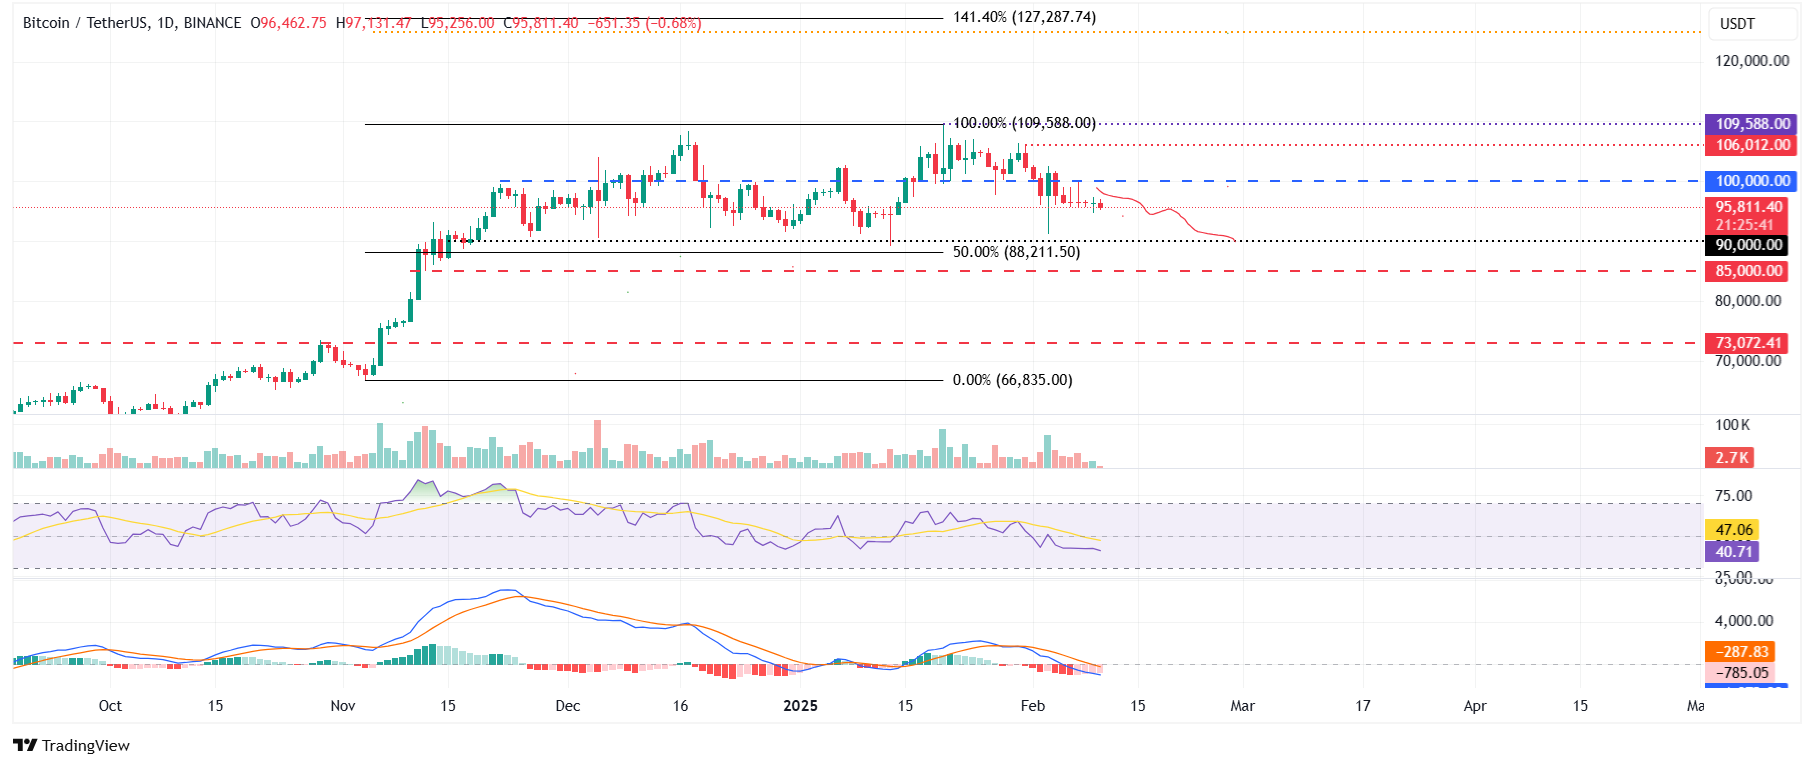
BTC/USDT daily chart
However, if BTC recovers and finds support around $100,000, it would extend the recovery to retest its January 31 high of $106,012.
Ethereum bears aiming to hit $1,900
Ethereum price faced a rejection around its descending trendline on February 1 and declined 13.87%, closing below its $3,000 psychologically important level the next day. ETH continued its correction by nearly 9% in the previous week. At the start of this week on Monday, it edges down, trading around $2,584.
If ETH continues its decline and closes below $2,359, it will extend the decline to test its next weekly support at $1,905.
The RSI on the daily chart reads 29, below its oversold level of 30, indicating a strong bearish momentum. The MACD also continued to show a bearish crossover last week, suggesting the continuation of a bearish trend.
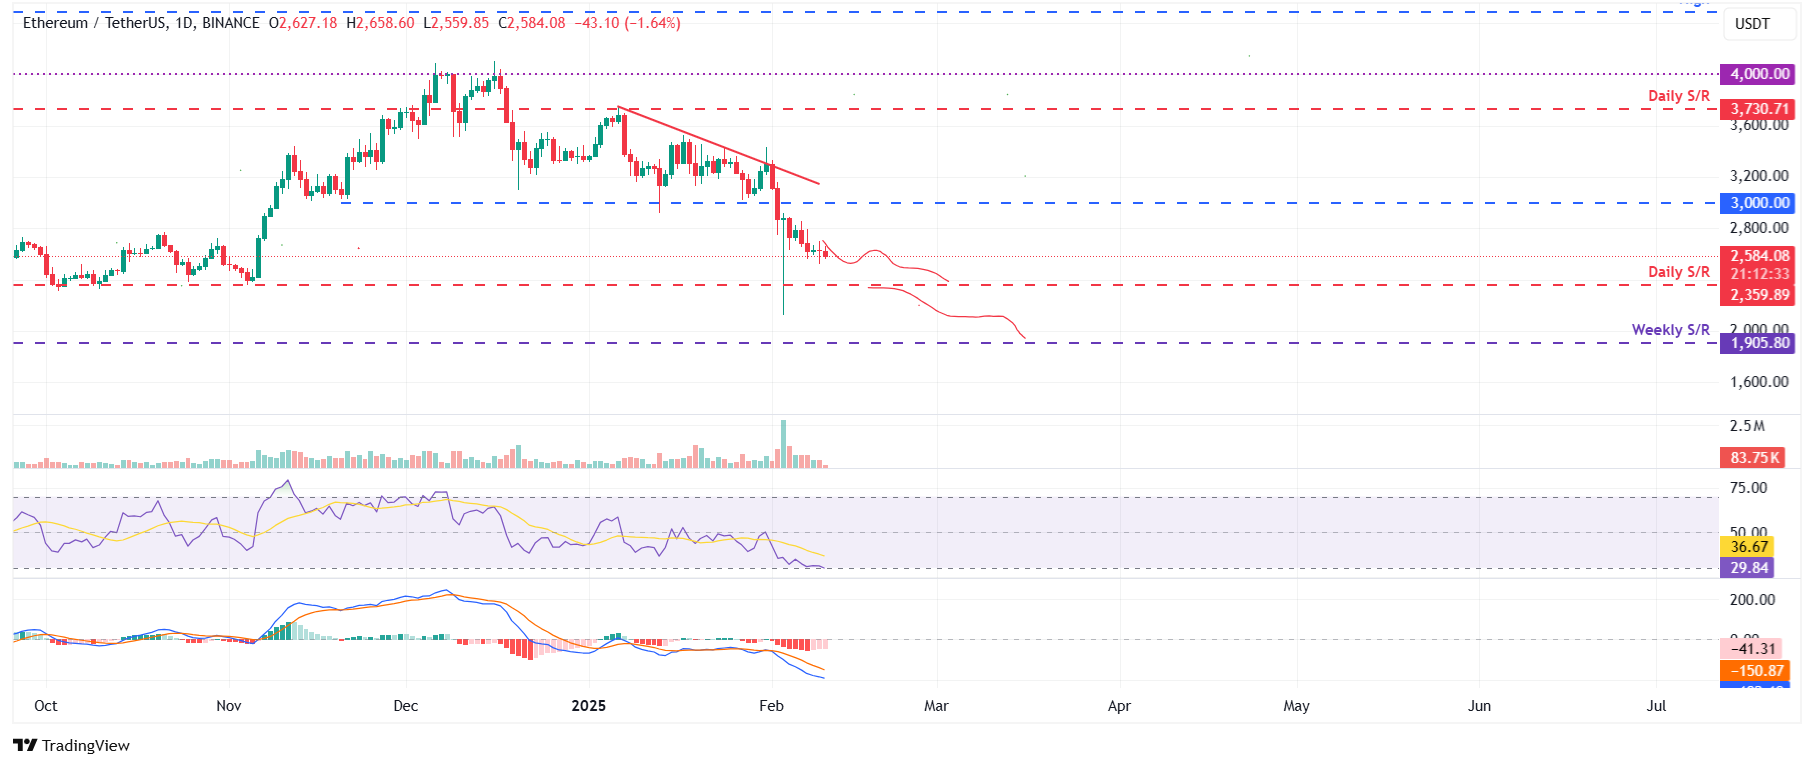
ETH/USDT daily chart
On the other hand, if ETH recovers, it could extend the recovery to test its $3,000 level.
Ripple is set for a downward move as it faces rejection around $2.72
Ripple price broke below its ascending trendline (drawn by connecting multiple lows since early January) on February 2 and declined by 10.35%, closing below its daily support at $2.72. On Tuesday, XRP faced rejection around the daily level of $2.72 and declined by 11.38% at Sunday’s close. At the time of writing on Monday, it continues to trade down around $2.34.
Suppose XRP continues its pullback and closes below its daily support at $1.96. It could extend the decline to test its weekly support level at $1.40.
The RSI on the daily chart reads 35, heading towards its oversold level of 30, indicating a strong bearish momentum. The MACD also continued to show a bearish crossover, suggesting the continuation of a bearish trend.
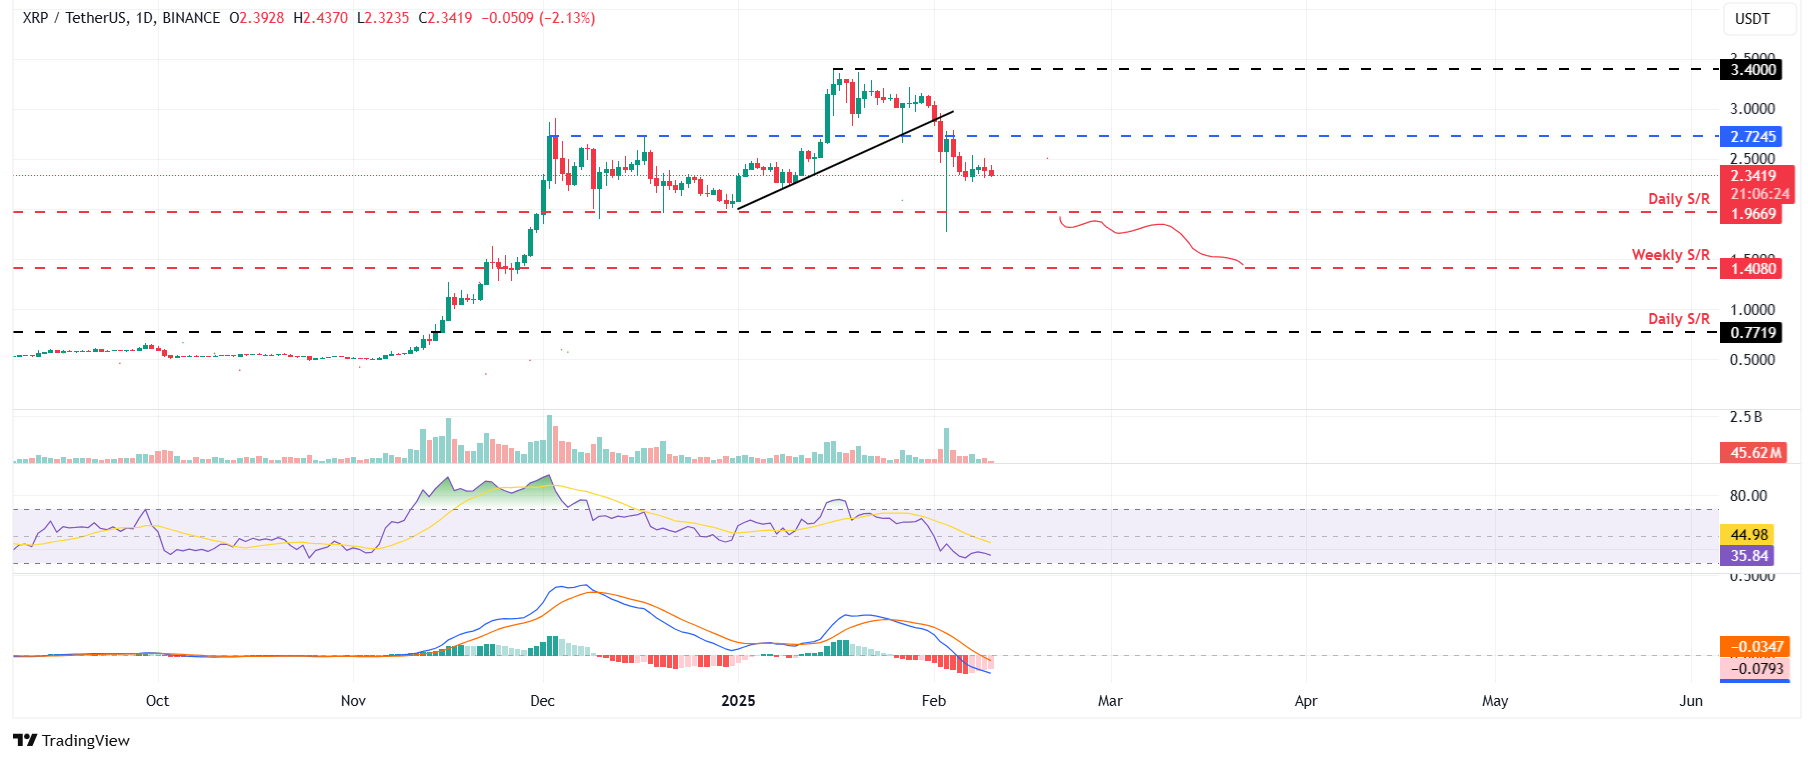
XRP/USDT daily chart
On the other hand, if XRP recovers, it could extend the recovery to test its daily resistance level at $2.72.
* The content presented above, whether from a third party or not, is considered as general advice only. This article should not be construed as containing investment advice, investment recommendations, an offer of or solicitation for any transactions in financial instruments.


