Bitcoin Price Forecast: BTC recovers after retesting $90K support
- Bitcoin Drops to $70,000. U.S. Government Refuses to Bail Out Market, End of Bull Market or Golden Pit?
- Gold rallies further beyond $5,050 amid flight to safety, dovish Fed expectations
- Bitcoin Bottom Debate: $70,000 or $50,000?
- A Crash After a Surge: Why Silver Lost 40% in a Week?
- Bitcoin Slips Below 75,000 Mark. Will Strategy Change Its Mind and Sell?
- Bitcoin Rout. Bridgewater Founder Dalio Publicly Backs Gold.

Bitcoin price today: $95,500
Bitcoin price recovers, trading around $95,500 on Tuesday after dipping below $90,000 the previous day.
The recent dip triggered a wave of liquidations, totaling over $734 million and more than $152 million, specifically in BTC.
Traders should remain cautious as this week’s upcoming macroeconomic events could bring more volatility in BTC.
Bitcoin’s (BTC) price recovers and trades at around $95,500 on Tuesday after dipping below $90,000 the previous day. The recent downturn at the start of the week has liquidated over $734 million in total liquidations, more than $152 million specifically in BTC. Traders should remain cautious, as this week’s upcoming macroeconomic events could bring more volatility in BTC.
Bitcoin price correction liquidated leveraged traders
Bitcoin price dipped below $90K, reaching a low of $89,256, but recovered quickly to close above $94,500 on Monday. This recent price correction triggered a wave of liquidations, resulting in over $734 million in total liquidations and more than $152 million specifically in BTC, according to data from CoinGlass.
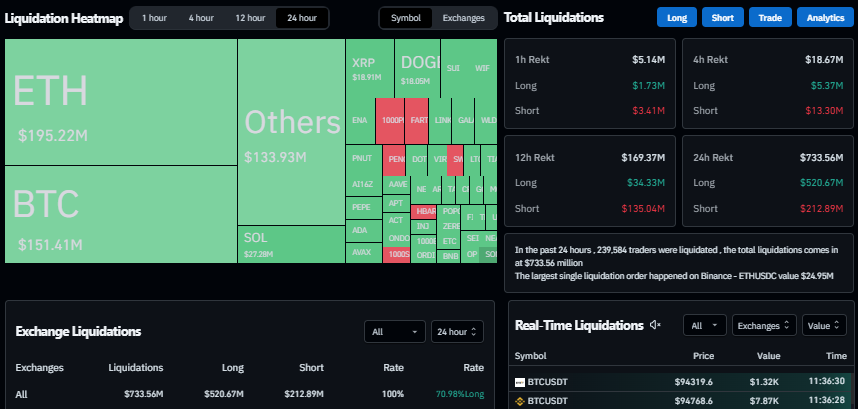
Total Liquidation chart. Source: Coinglass
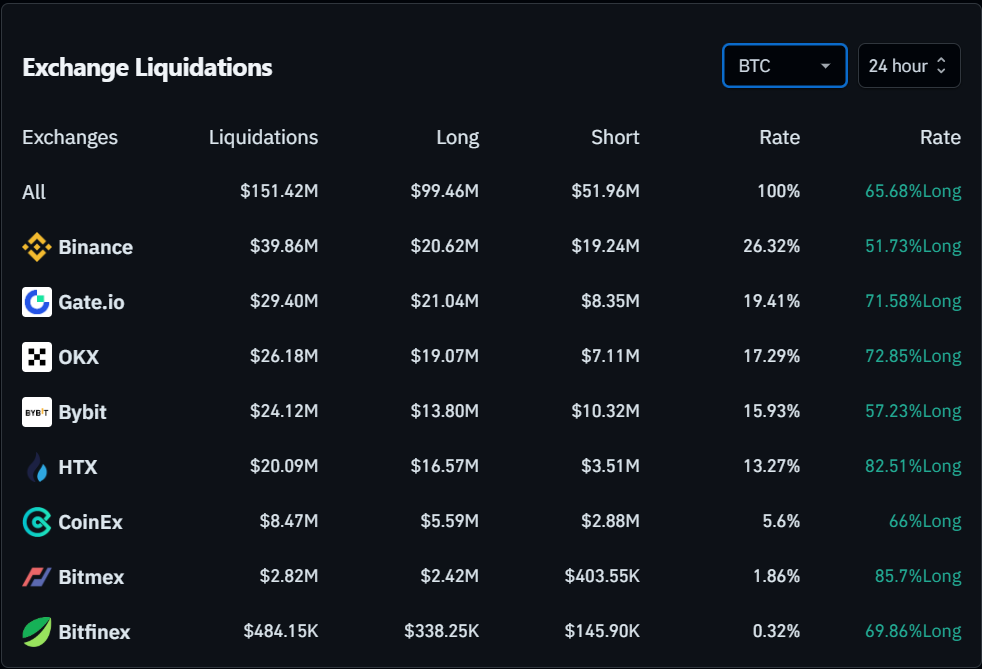
Bitcoin Liquidation chart. Source: Coinglass
Looking down on institutional demand, signs of weakness continued. According to Coinglass, Bitcoin spot Exchange Traded Funds (ETF) data recorded an outflow of $284.10 million on Monday, continuing its outflows since January 8. If the magnitude of the outflow continues or intensifies, Bitcoin’s price could decline further.

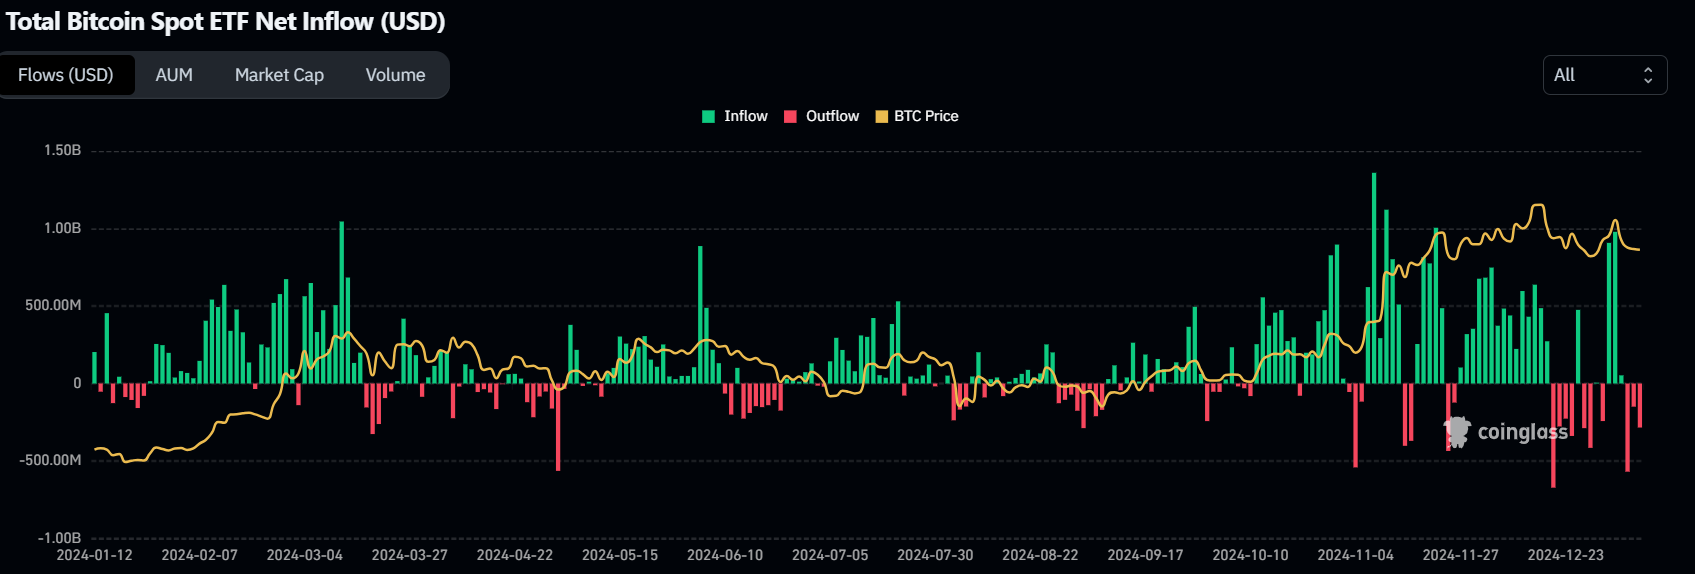
Total Bitcoin spot ETF Net Inflow chart. Source: Coinglass
In an exclusive interview with cryptocurrency exchange Bitfinex, analysts told FXStreet, “Rising US Treasury yields have hit a 14-month high at 4.79%, drawing institutional money away from riskier assets like Bitcoin.”
The analyst further explains that BTC historically reacts quickly to yield spikes. Still, the impact was compounded this time by the news that the US Department of Justice plans to liquidate $6.5 billion in seized Bitcoin. Despite macroeconomic pressures, Bitcoin remains resilient — still up 42% since the US presidential election in November — outperforming equities, which have erased post-election gains. However, with the Federal Reserve (Fed) signaling fewer interest rate cuts and tightening financial conditions, Bitcoin may face more short-term volatility.
“Optimism around pro-crypto regulation under the incoming administration of President-elect Donald Trump could, however, still limit deeper losses and keep BTC in a strong long-term position,” said Bitfinex analysts.
Fed’s hawkishness is ‘more important than Trump’ for the Bitcoin – 10xResearch report
A 10xResearch report highlights that the upcoming Fed hawkishness is ‘more important than Trump’ for the Bitcoin market. The report explains that as the negative inflation narrative overshadows Trump’s inauguration, Bitcoin could face further selling pressure, at least until the release of the US Consumer Price Index (CPI) data on Wednesday.
Markus Thielen, head of research at 10xResearch, expects cryptocurrency prices to trade “sideways” until mid-2025.
The report further explains that the on-chain data is approaching levels historically associated with profit-taking by smart money. The graph below shows that the Market Value to Realized Value (MVRV) ratio has reached 2.7x, often triggering profit-taking. While the MVRV ratio has occasionally risen to 4x or even 6x, it signaled the onset of a major consolidation or correction in three out of the last four instances where it reached 2.7x.
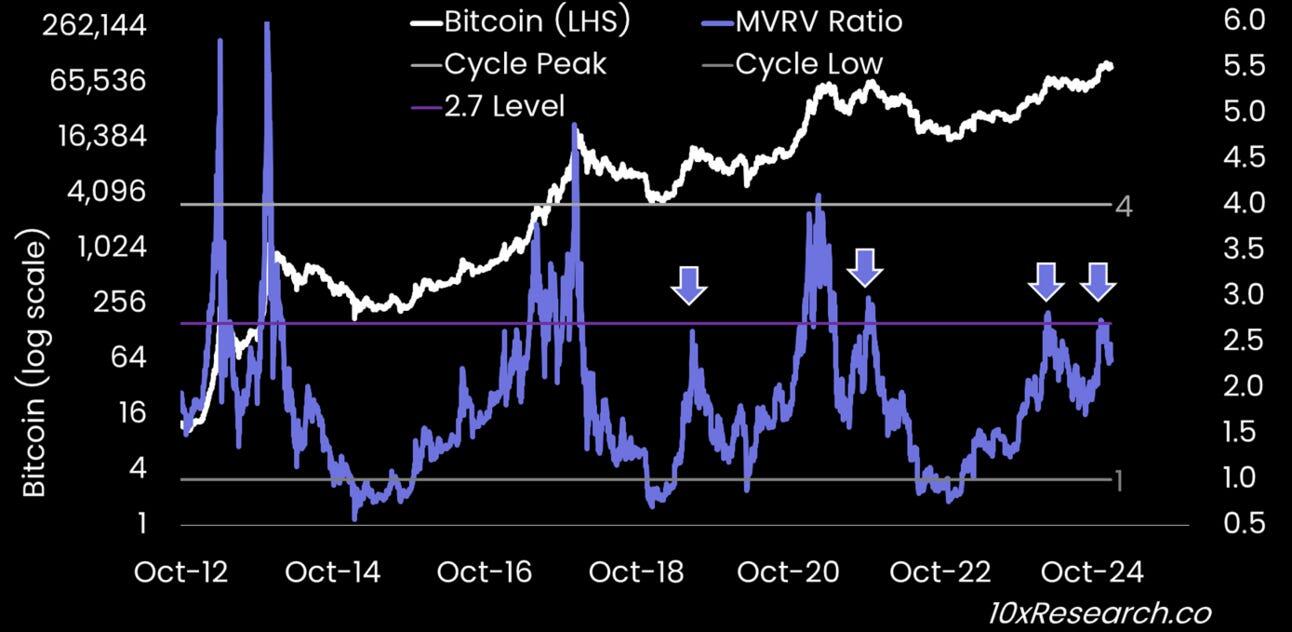
Bitcoin (log chart) vs. MVRV Ratio chart. Source: 10xResearch
Lastly, the report concluded that, coupled with the macro outlook — anticipating the Federal Reserve’s hawkish stance to persist for several more months — and the observation that technical indicators have yet to reach levels signaling favorable risk-to-reward ratios for long positions, Bitcoin could see a strong probability of testing downside targets at $76,000 and potentially $69,000.
Bitcoin Price Forecast: BTC bounces off after retesting $90K mark
Bitcoin’s price dipped, reaching a low of $89,256, but recovered quickly and closed above $94,500 on Monday. At the time of writing on Tuesday, it hovers around $95,500.
If BTC continues its correction and closes below $90,000, it would extend an additional decline to retest its next support level at $85,000.
The Relative Strength Index on the daily chart flattens near the neutral level of 50, indicating a lack of momentum. However, the Moving Average Convergence Divergence (MACD) indicator shows a bearish crossover on Wednesday, suggesting a sell signal and a continuation of the ongoing correction.
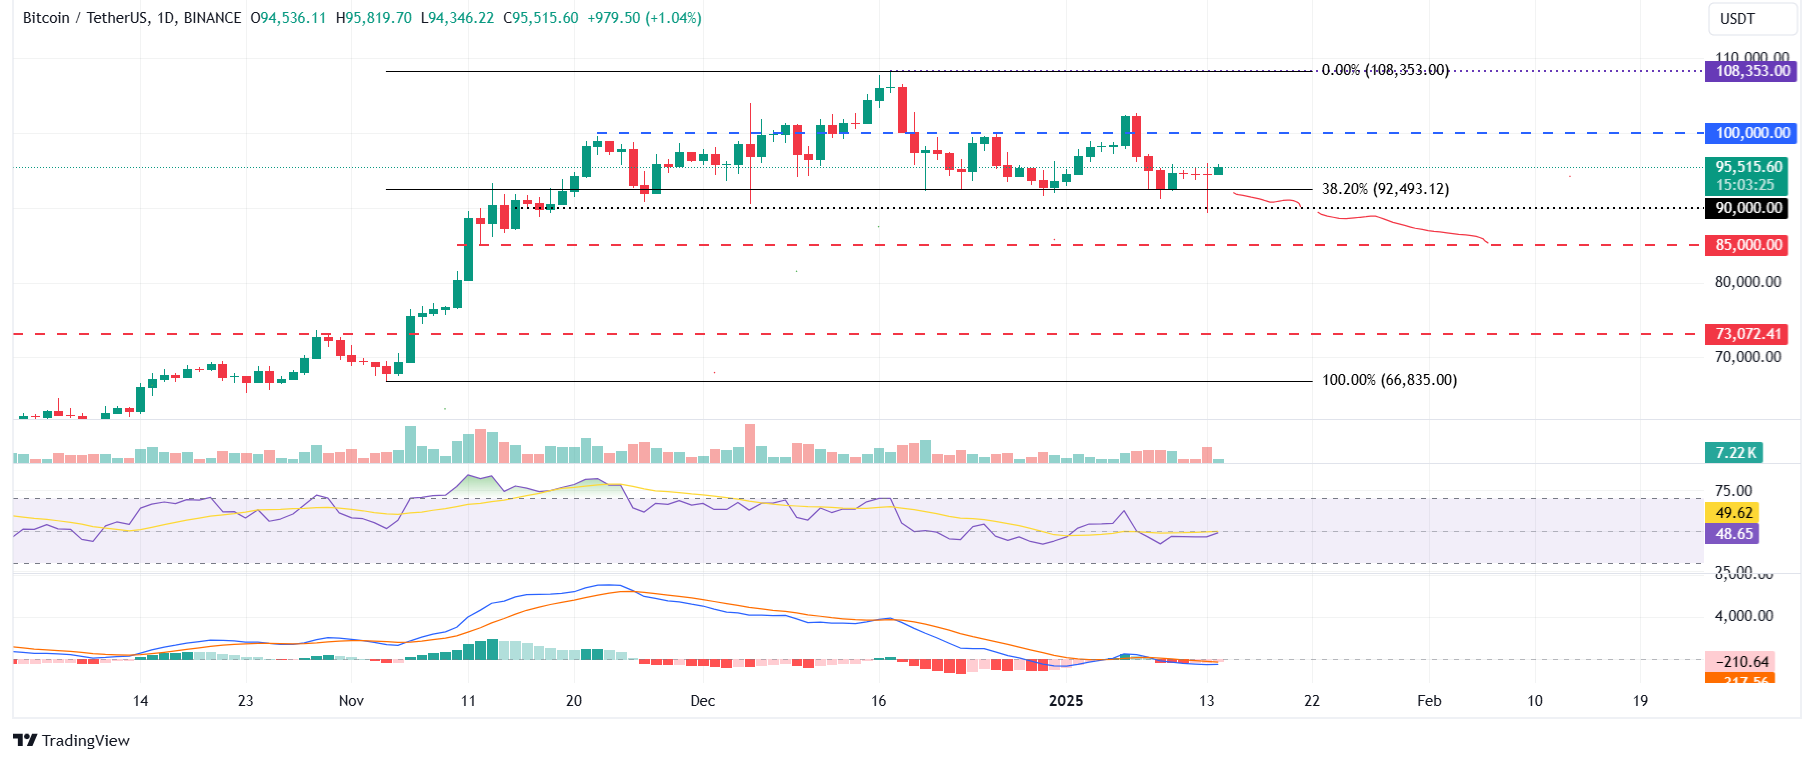
BTC/USDT daily chart
If BTC recovers and closes above the $100,000 level, it could extend the rally to retest the December 17, 2024, all-time high of $108,353.
Read more
* The content presented above, whether from a third party or not, is considered as general advice only. This article should not be construed as containing investment advice, investment recommendations, an offer of or solicitation for any transactions in financial instruments.


