

FTX Claims Website Goes Live, Triggering Intraday Surge in Platform Token FTT

- Gold Price Forecast: Gold Poised to Break $4,200 as Oil Price Slump Eases Inflation Fears
- Gold declines despite easing concerns over inflation, interest rate hikes
- Fed Decision Eve: 104 Economists Expect No Change; Why Is Citadel Securities Betting on a Surprise Hike?
- Gold Price Forecast: Can Gold Hold $4,020 as Fed Rate Hike Expectations Rise?
- Middle East War updates: US-Iran pause strikes as Trump weighs up diplomatic options
- WTI Oil flirts with the $80 level amid speculation about US-Iran peace talks

On July 12th, the cryptocurrency derivatives trading platform FTX officially launched its claims website, leading to a surge in its platform token FTT. FTT reached a high of $1.8, representing a 31% increase.
However, approximately one hour later, the FTX claims website went offline and is currently showing as unavailable. Following this, FTT started to decline, and as of the time of writing, it was quoted at $1.6.
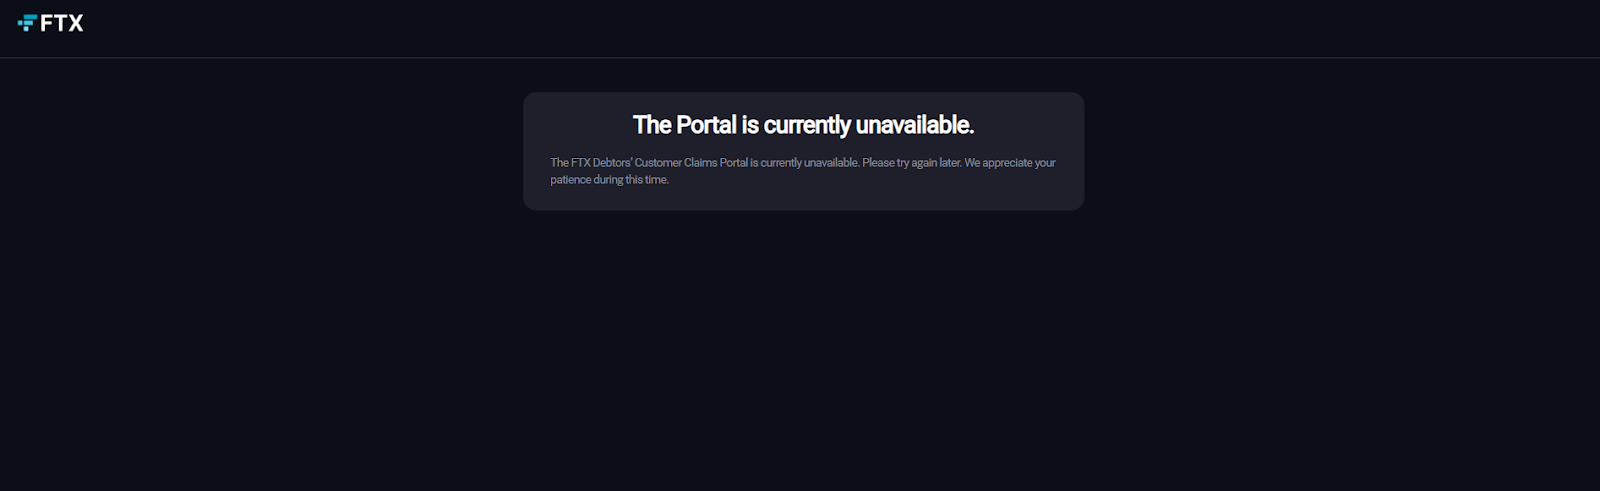
FTX Claims Website, Source: FTX.
The official explanation for the suspension of the claims website has not been provided yet. However, a post was made to alert creditors to be cautious of phishing links and emphasized that chaims.ftx.com is the only official legitimate website for claims.
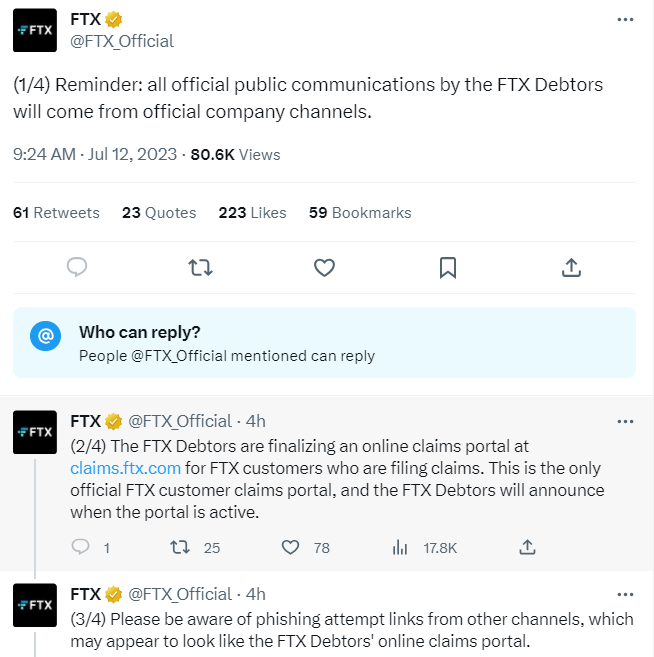
Official FTX Tweet, Source: Twitter
Biting the knife and licking blood is an important characteristic of the cryptocurrency market. Many people like to go against the trend. Currently, FTT has dropped from its peak of $84 to the current $1.6, a decline of 98%. However, there are still around 28,000 holding addresses.
Additionally, according to CMC data as of July 12th, FTT has a market capitalization of $500 million, ranking 215 globally, with a 24-hour trading volume of $90 million.
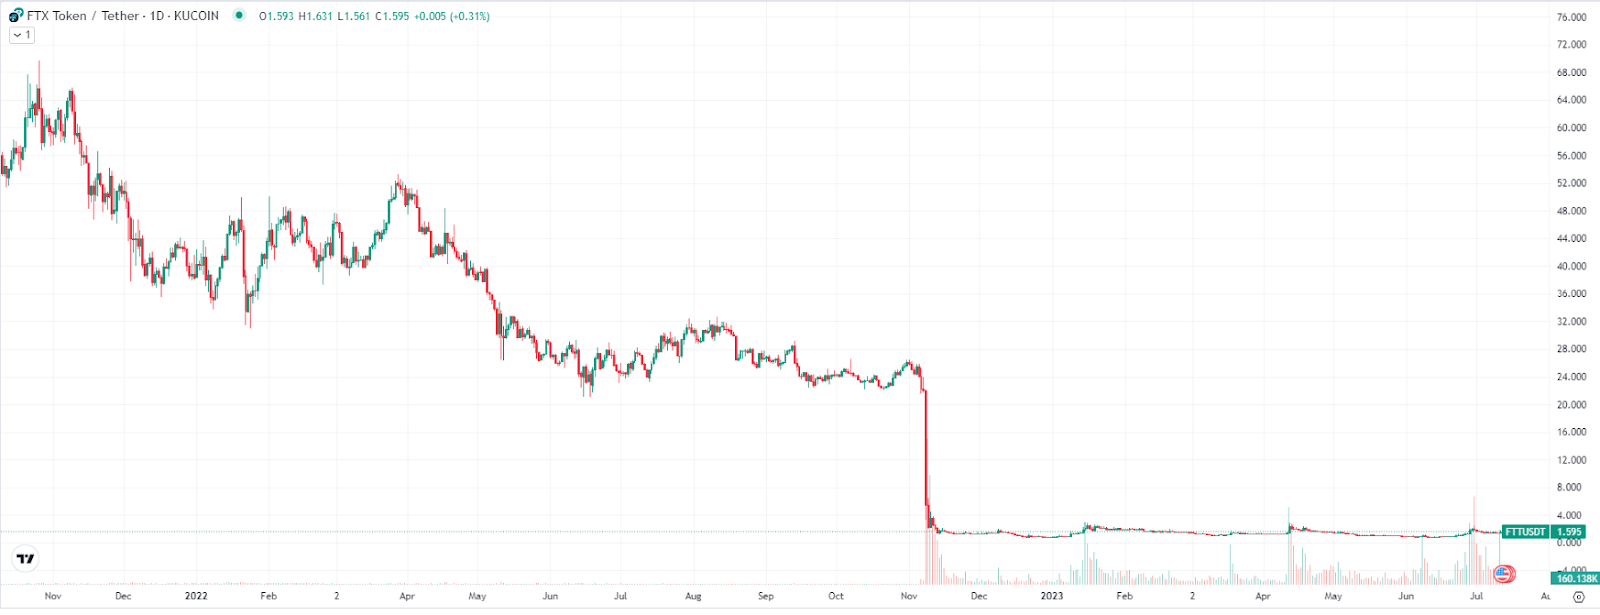
Price Trend of Platform Token FTT from 2022 to Present, Source: TradingView.
So, is it still worth holding FTT in the long term? Generally, the value of platform tokens relies on the development of the platform, with trading volume being a key indicator as it generates revenue.
Currently, the FTX platform is in a suspended state, which means FTT has lost its foundation and value support. In this situation, buying and holding FTT for the long term is considered highly risky.
While there have been multiple rumors in the market about FTX's potential restart, which has provided some boost to FTT, there hasn't been a clear and specific plan observed. Uncertainty remains high.
Next, for FTT to regain its peak, it would require a significant injection of capital or potentially being acquired by top exchanges such as Binance, Coinbase, and others. Without such developments, FTT may continue to struggle or even exit the historical stage.
While long-term investment in FTT carries high risks and may not be feasible, the same cannot be said for short-term trading. Since 2023, FTT has been experiencing significant fluctuations within a range of $0.8 to $2.8, with a 250% amplitude. On average, there is a peak every two months, making it suitable for short-term swing trading.
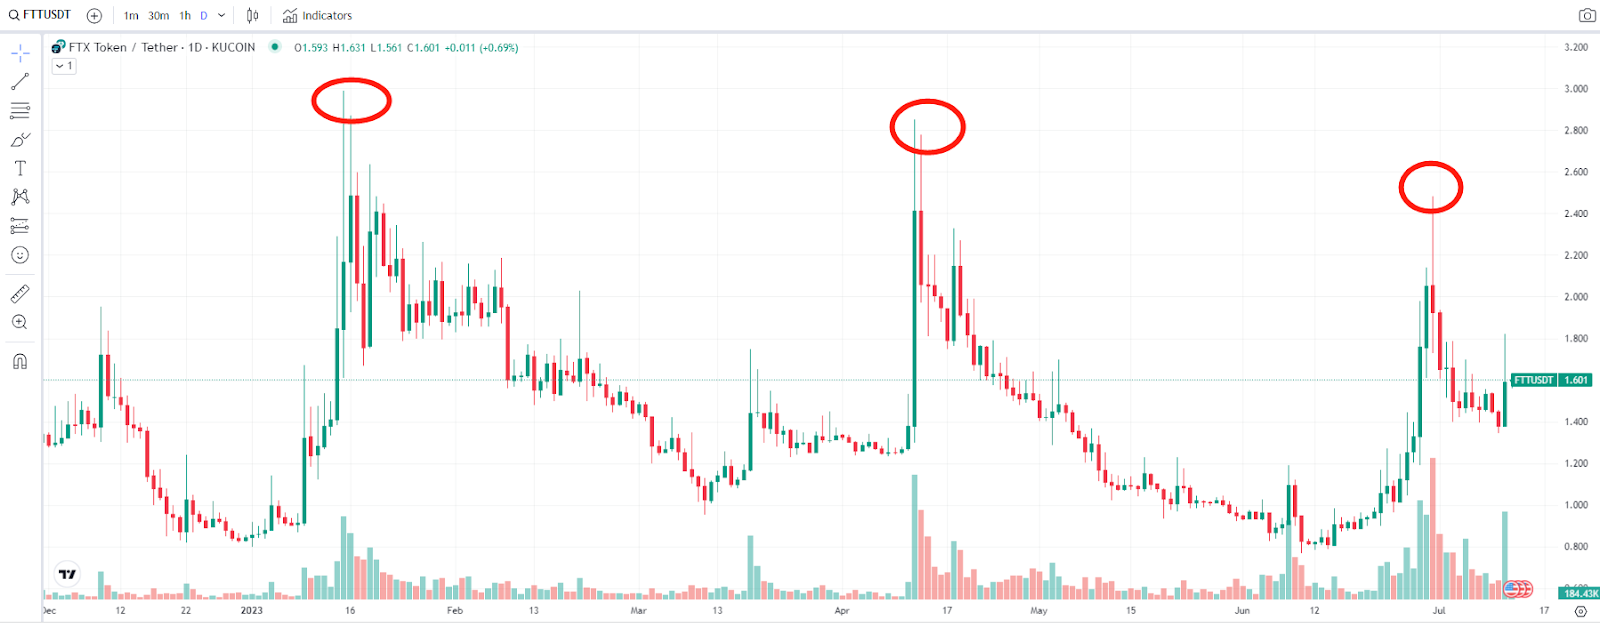
Price Trend of Platform Token FTT from January 1, 2023 to July 12, 2023, Source: TradingView
Read more
* The content presented above, whether from a third party or not, is considered as general advice only. This article should not be construed as containing investment advice, investment recommendations, an offer of or solicitation for any transactions in financial instruments.


