

Silver price edges lower to $32.75 in Wednesday’s Asian session.
The constructive outlook of Silver remains in play above the 100-day EMA with the bullish RSI indicator.
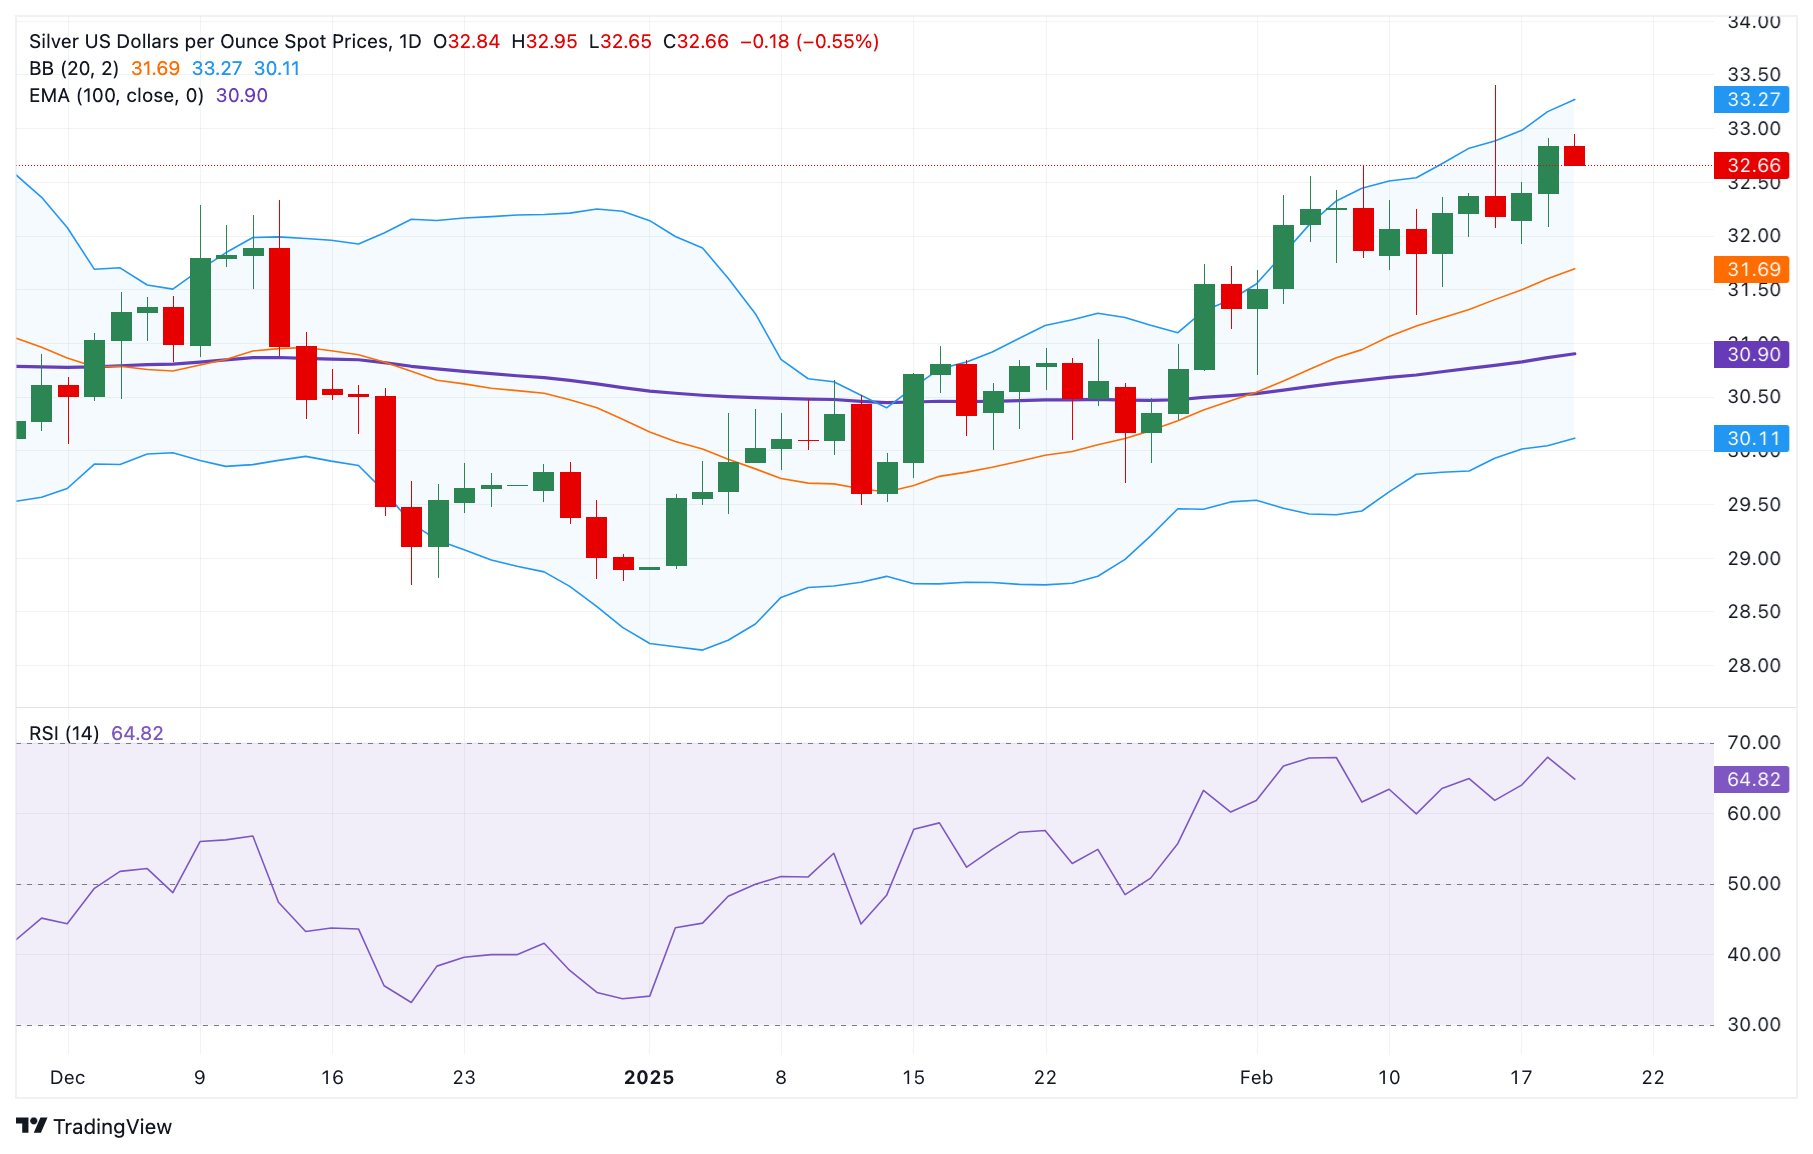
The first upside barrier emerges at the $33.30-$33.40 region; the initial support level is located at $31.79.
Silver price (XAG/USD) attracts some sellers to near $32.75 during the Asian trading hours on Wednesday. The downside for the white metal might be limited amid the policy uncertainty, including tariff fears under US President Donald Trump’s administration. Later on Wednesday, the FOMC Minutes will be in the spotlight.
According to the daily chart, Silver keeps a bullish vibe at present as the price is well-supported above the key 100-day Exponential Moving Average (EMA). Furthermore, the upward momentum is supported by the 14-day Relative Strength Index (RSI), which is located above the midline near 66.30, suggesting that the path of least resistance is to the upside.
The immediate resistance level for Silver price emerges in the $33.30-$33.40 zone, representing the upper boundary of the Bollinger Band and the high of February 14. Any follow-through buying above this level could expose $34.55, the high of October 29, 2024. The next hurdle to watch is $34.87, the high of October 22, 2024.
On the other hand, the first downside target of the white metal is seen at $31.79, the low of February 7. The crucial contention level is located at the $31.00-$30.90 region, portraying the round mark and the 100-day EMA. Extended losses below the mentioned level could pave the way to $29.70, the low of January 27.
Silver price (XAG/USD) daily chart
* The content presented above, whether from a third party or not, is considered as general advice only. This article should not be construed as containing investment advice, investment recommendations, an offer of or solicitation for any transactions in financial instruments.


