Gold price bulls take a brief pause after the recent move up to one-month peak

Gold price stands firm near a one-month high amid bets for additional rate cuts by the Fed.
The recent pullback in the US bond yields and the USD further underpin the precious metal.
Israel-Hamas ceasefire deal holds back bulls from placing fresh bets around the XAU/USD pair.
Gold price (XAU/USD) enters a bullish consolidation phase during the Asian session on Friday and oscillates in a range around the $2,715 region, just below a one-month high touched the previous day. Expectations that softer inflation in the US will allow the Federal Reserve (Fed) to cut interest rates further this year led to the recent decline in the US Treasury bond yields and the US Dollar (USD). This, in turn, is seen as a key factor that continues to underpin the non-yielding yellow metal and supports prospects for additional gains.
That said, easing fears about US President-elect Donald Trump's disruptive trade tariffs, along with the Israel-Hamas ceasefire deal, keep a lid on the safe-haven Gold price. Apart from this, growing acceptance that the Fed will pause its rate-cutting cycle later this month, a modest US Dollar (USD) uptick and bets for a Bank of Japan (BoJ) rate hike next week cap the precious metal. Nevertheless, the XAU/USD remains on track to register gains for the third straight week as traders look to the US housing market data for some impetus.
Gold price draws support from expectations that the Fed will cut rates twice this year
US data released this week pointed to signs of abating inflation and fueled speculations that the Federal Reserve will cut rates twice this year, which, in turn, benefitted the non-yielding Gold price.
Adding to this, Fed Governor Christopher Waller said on Thursday that inflation is likely to continue to ease and three or four rate cuts are still possible this year if US economic data weakens further.
The outlook for the Fed's rate cuts this year led to a further decline in the US Treasury bond yields and kept the US Dollar close to a one-week low, lending additional support to the XAU/USD.
Meanwhile, a report published by the US Commerce Department showed that Retail Sales increased 0.4% in December and the previous month's reading was also revised higher to show a 0.8% gain.
Furthermore, the Philly Fed's Manufacturing Index surpassed even the most optimistic estimates and surged to the highest level since April 2021, to 44.3 this month from a revised -10.9 in December.
Separately, the US Labor Department reported that Jobless Claims – a key indicator of the health of the U.S. labor market – rose from 203K previous to 217K during the week ending January 10.
The data reaffirmed expectations that the Fed will pause its rate cycle later this month amid worries that US President-elect Donald Trump's policies will stoke inflation.
Israeli Prime Minister Benjamin Netanyahu announced on Friday that a ceasefire deal that would pause 15 months of war with Hamas and release hostages held in Gaza has been reached.
Friday's US economic docket features the release of Building Permits, Housing Starts and Industrial Production figures, which might influence the USD and the precious metal.
Gold price bulls need to wait for acceptance above $2,720 before placing fresh bets
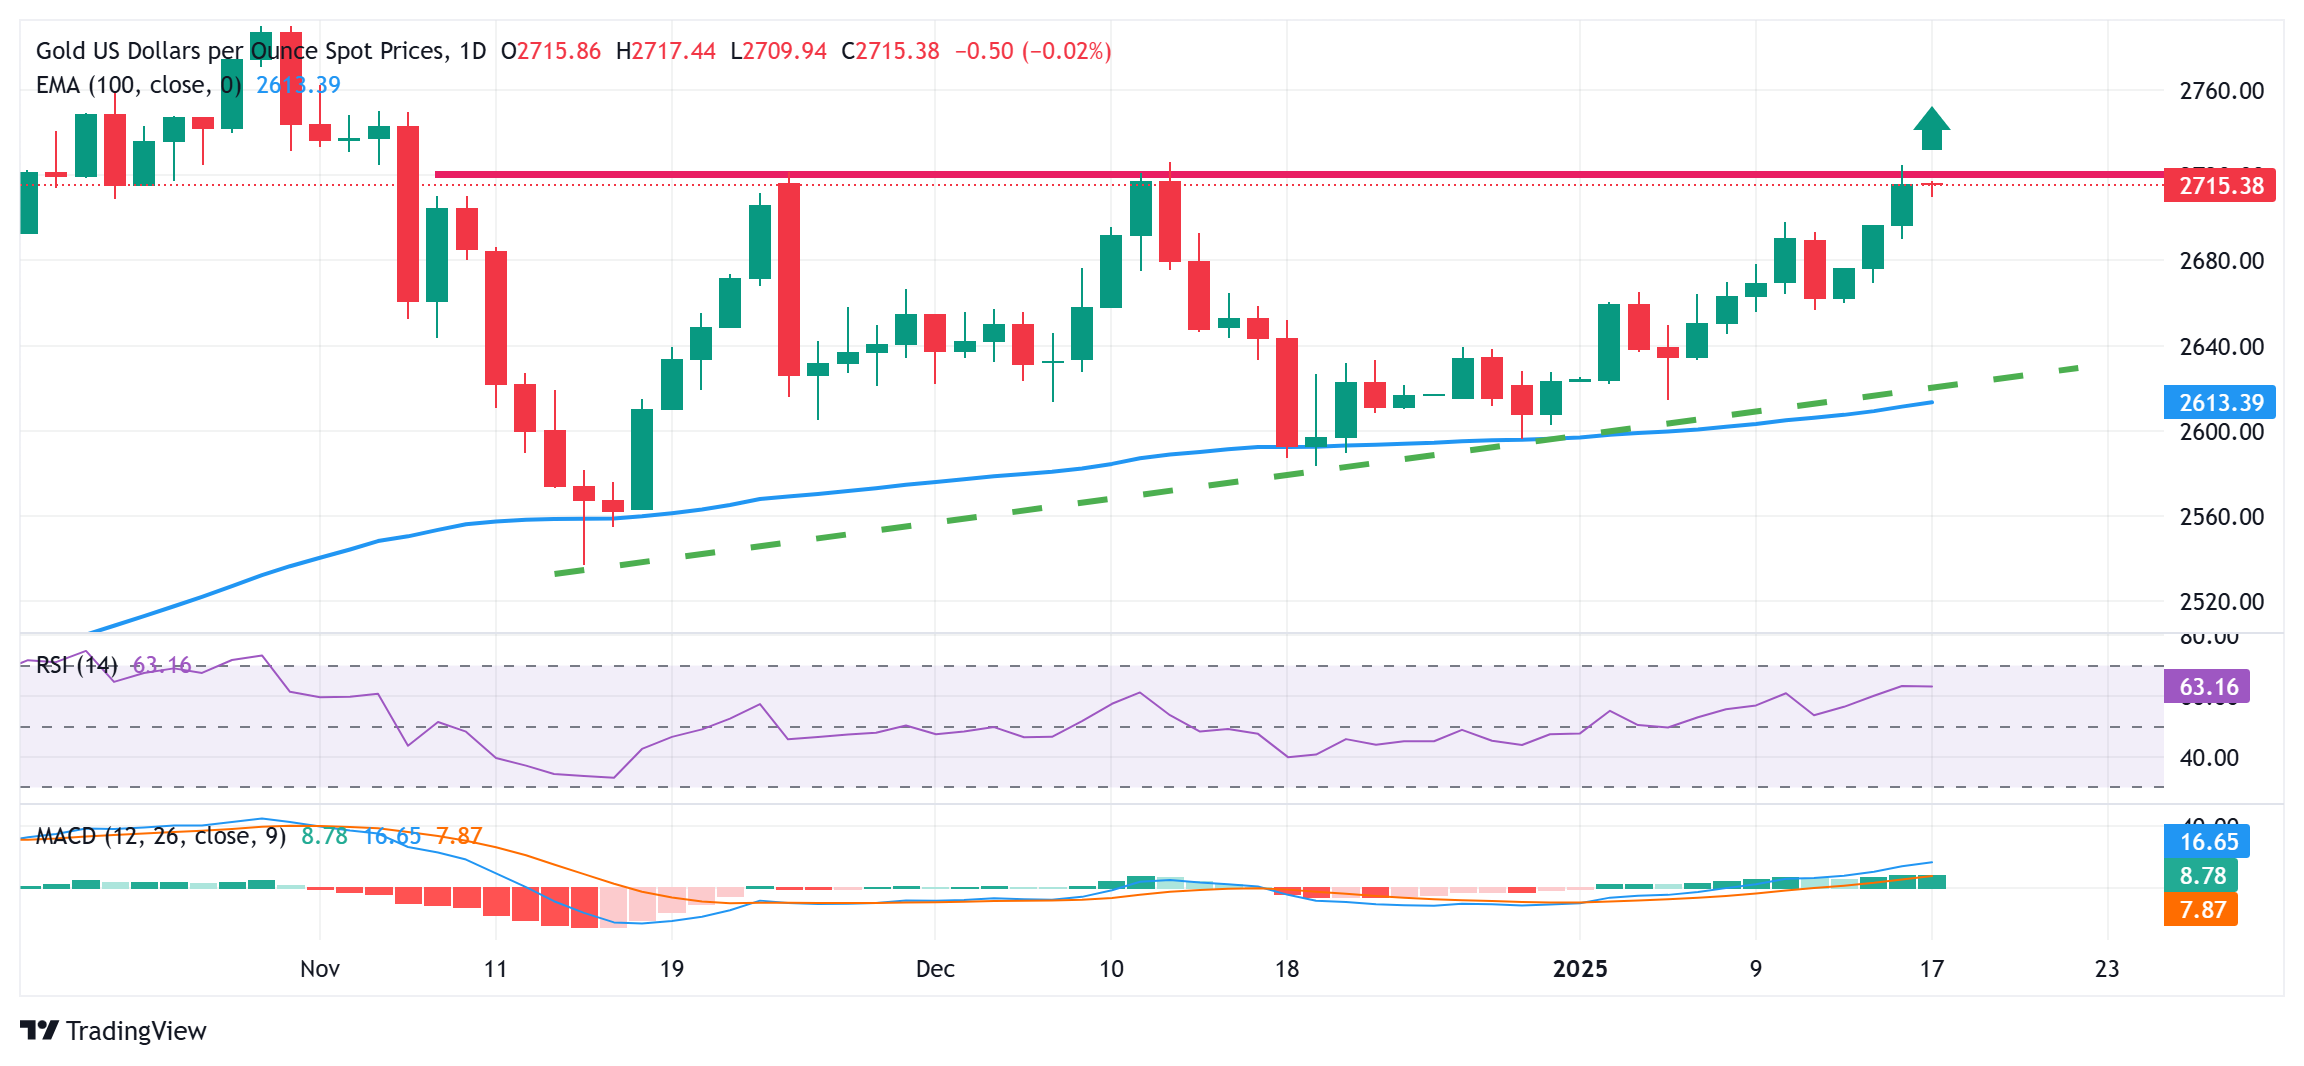
From a technical perspective, positive oscillators on the daily chart favor bullish traders and support prospects for additional gains. That said, it will still be prudent to wait for sustained strength and acceptance above the $2,715-2,720 supply zone before placing fresh bullish bets. The Gold price might then climb to the $2,745 intermediate hurdle en route to the $2,760-2,762 area, before aiming to challenge the all-time peak, around the $2,790 region touched in October 2024.
On the flip side, any corrective pullback now seems to find decent support near the $2,700-2,690 area. A further decline could be seen as a buying opportunity and remain limited near the $2,662-2,660 region. The latter should act as a pivotal point, below which the Gold price could fall to the $2,635 zone en route to the $2,650 confluence – comprising the 100-day Exponential Moving Average (EMA) and a short-term ascending trend-line extending from the November swing low.
* The content presented above, whether from a third party or not, is considered as general advice only. This article should not be construed as containing investment advice, investment recommendations, an offer of or solicitation for any transactions in financial instruments.


