

Silver attracts some buyers on Tuesday and snaps a two-day losing streak.
Mixed technical indicators on the daily chart warrant some caution for bulls.
Corrective slides could be seen as a buying opportunity and remain limited.
Silver (XAG/USD) builds on the previous day's modest bounce from the vicinity of the $32.00 mark, or a nearly one-week low, and gains some positive traction during the Asian session on Tuesday. The white metal, for now, seems to have snapped a two-day losing streak and currently trades just below mid-$32.00s, up 0.25% for the day.
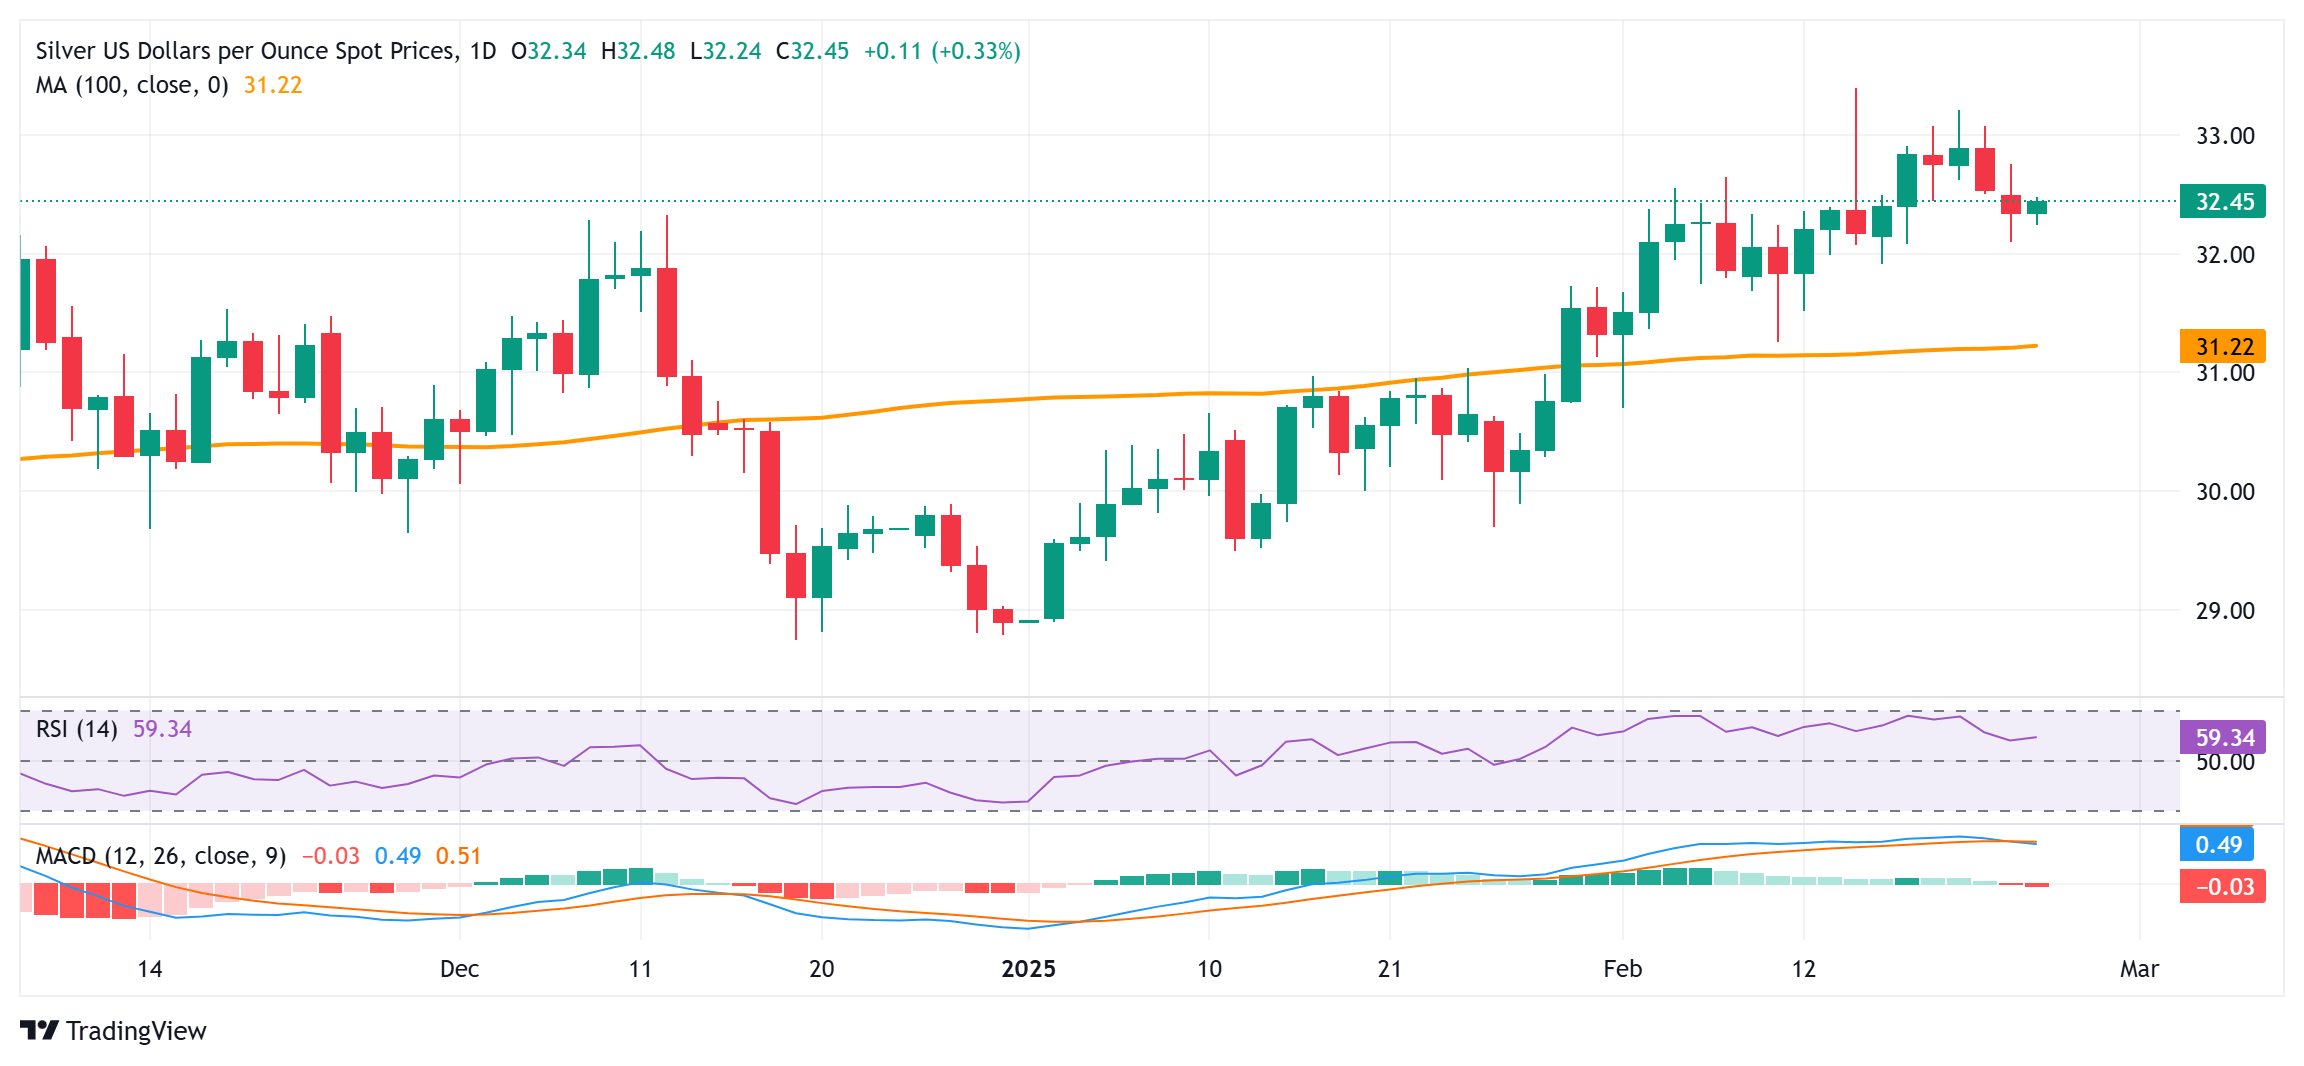
From a technical perspective, the recent repeated failures to find acceptance above the $33.00 mark and the subsequent pullback warrant caution for bullish traders amid mixed oscillators on the daily chart. Hence, it will be prudent to wait for sustained strength and acceptance above the said handle before positioning for an extension of a well-established uptrend from sub-$29.00 levels, or the year-to-date low touched in January.
The XAG/USD might then aim to surpass the monthly swing high, around the $33.40 area touched on February 14, and climb further towards reclaiming the $34.00 mark. The momentum could extend further towards the $34.45 intermediate hurdle en route to the $35.00 neighborhood, or the multi-year peak touched in October.
On the flip side, the $32.10-$32.00 area now seems to have emerged as an immediate strong support ahead of the $31.75 region. Any further slide could be seen as a buying opportunity and help limit the downside for the XAG/USD near the $31.25 zone. The latter coincides with the 100-day Simple Moving Average (SMA) and should act as a key pivotal point. Hence, a convincing break below might shift the bias in favor of bearish traders.
The subsequent decline has the potential to drag the XAG/USD below the $31.00 round-figure mark, towards testing the the next relevant support near the $30.25 region, the $30.00 psychological mark, and the $29.55-$29.50 horizontal zone.
Silver daily chart
* The content presented above, whether from a third party or not, is considered as general advice only. This article should not be construed as containing investment advice, investment recommendations, an offer of or solicitation for any transactions in financial instruments.


