


Gold is expected to continue its short-term rebound and experience upward volatility. Resistance levels are at $1954 and $1980, while support levels are at $1903 and $1885. Despite the non-farm payroll data beating expectations, gold initially rose but ultimately fell. Looking at CFTC positioning data and technical analysis, the medium to long-term downtrend in gold remains unchanged, but there may be short-term upward volatility.
Market Review
Last week (Aug 28th - Sep 3rd), there were mixed movements in precious metals, with gold rising by 1.0% and silver experiencing a slight decline of 0.3%. Gold continued its minor rebound from the previous week but was influenced by the better-than-expected non-farm payroll data, resulting in an initial rise followed by a fall, ultimately closing at $1938.8.
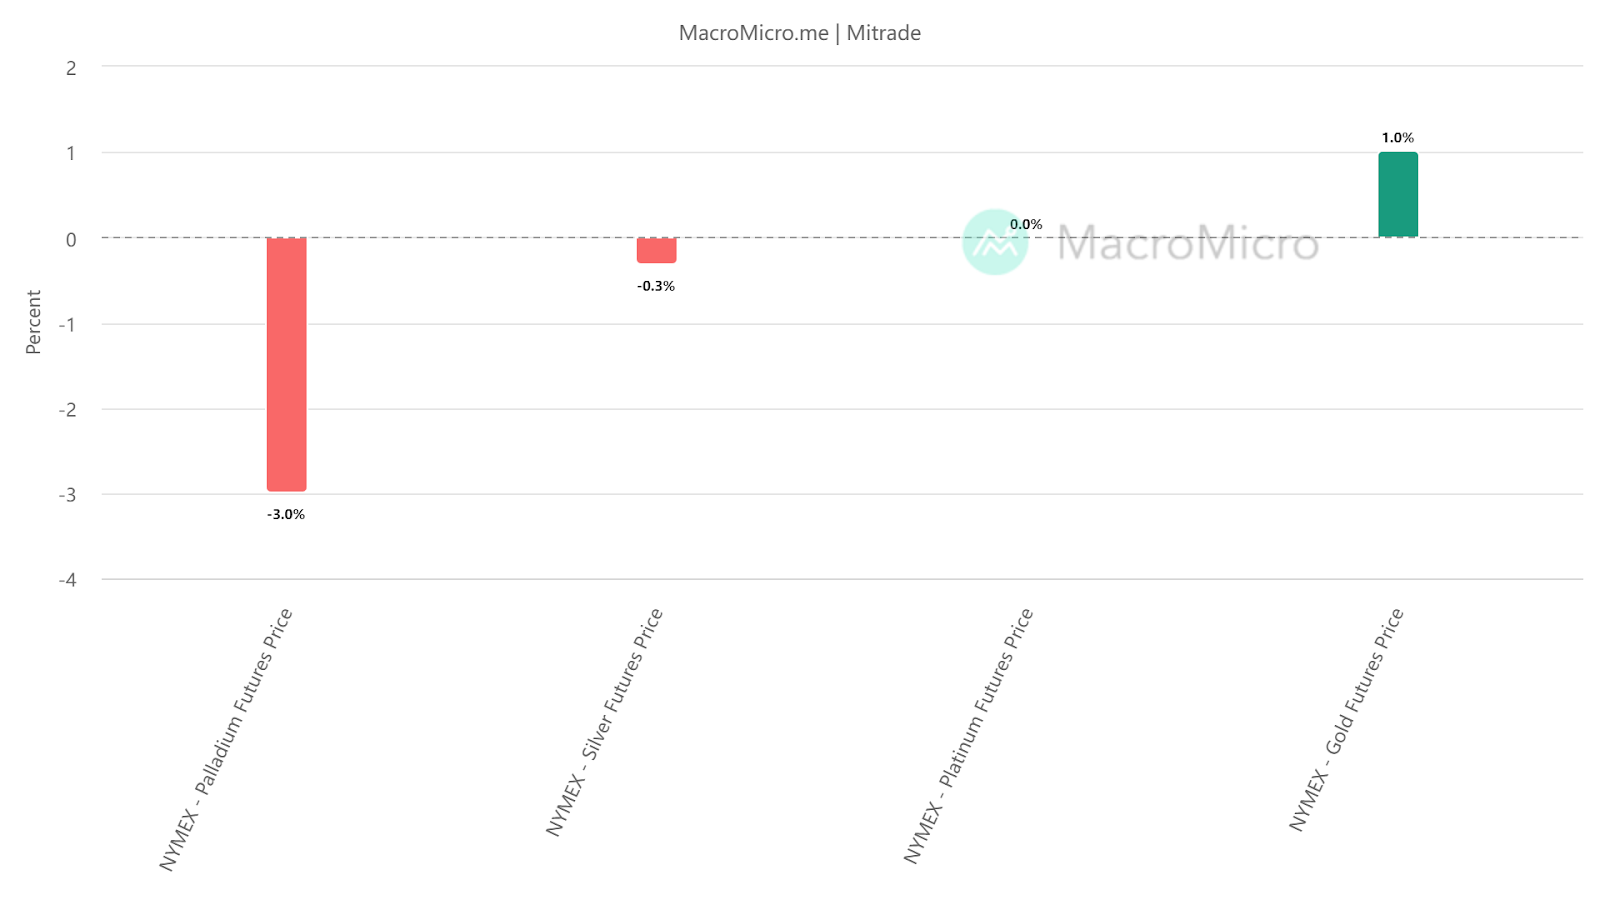
Source: MacroMicro - Percentage Change of Major Precious Metal futures in Aug 28th- Sep 3rd
Though Non-farm Payrolls Slightly Exceeded Expectations, Job Demand Continues to Decline Steadily
On the evening of Sep 1st local time, the latest data released by the US Bureau of Labor Statistics showed that non-farm payrolls added 187,000 jobs in August, surpassing the expected value of 170,000, with the previous figure revised down from 187,000 to 157,000. Over the past year, the average monthly increase in employment in the United States has been 271,000, significantly lower than the monthly average of 399,000 in 2022. The better-than-expected performance in non-farm payrolls led to a slight dip in gold prices during trading.
Furthermore, in August, the US unemployment rate rose by 0.3 percentage points to 3.8%, reaching a new high since Feb 2022, exceeding the expected and previous value of 3.5%. The growth rate of average hourly earnings narrowed to 0.2% compared to the previous value of 0.4% and the expected value of 0.3%, while the YOY increase in hourly earnings slightly slowed down, recording 4.3%. The labor force participation rate increased by 0.2 percentage points to 62.8% in August, reaching a new high since the COVID-19 pandemic began in February 2020.
The unexpectedly weak July job openings data previously released indicates that job demand in the United States continues to decline steadily.
According to data released by the US Department of Labor on August 29th local time, there were 8.8 million job openings in July, lower than the previous value of 9.2 million and the market expectation of 9.46 million. This was the lowest level in nearly two years and the sixth consecutive monthly decline over the past seven months. In addition, the number of resignations decreased by 253,000 compared to the previous month, while layoffs remained unchanged.
In light of this, O'Kane, Senior Economist at Lightcast, believes that the larger-than-expected decline in job openings indicates a gradual slowdown in the US economic growth.
Mitrade Analyst
The moderate cooling of labor market demand, the decrease in resignations, and data such as the downward revision of second-quarter GDP growth indicate that the Fed's previous tightening policies are taking effect, and US economic growth is steadily slowing down. This will reduce the probability of a rate hike at the upcoming Federal Reserve meeting in September, suppress the US dollar, and support the rise of gold.
Speculative Long Positions Increase, Favorable for Short-term Gold
Recently, there has been an increase in speculative long positions and a decrease in short positions for gold. According to the updated CFTC position data from August 23rd to August 29th, speculative long positions in gold increased by 21,326 to reach 123,272 compared to the previous period. During the same period, open interest in gold futures contracts for speculative long positions increased by 9,714 to reach 236,054, while short positions decreased by 11,612. These indicators suggest that short-term market investors are optimistic about the future of gold.
Mitrade Analyst
In summary, the presence of increased speculative long positions and decreased short positions in the market indicates that investors have a positive outlook on the future of gold. As a result, gold is likely to experience a volatile upward movement this week.
Technical Analysis
From a technical indicator perspective, the 60-day MA is showing a downward trend. The 14-day RSI value is 58, close to 60. The MACD daily chart shows the short-term line crossing above the long-term line, forming a golden cross with a wide opening trend. The histogram is increasingly positioned above the horizontal line, with DIFF and DEA as positive values and MACD as a negative value. This indicates that gold is consolidating within a rebounding phase in the short term.
Resistance levels: 1954, 1980
Support levels: 1903, 1885
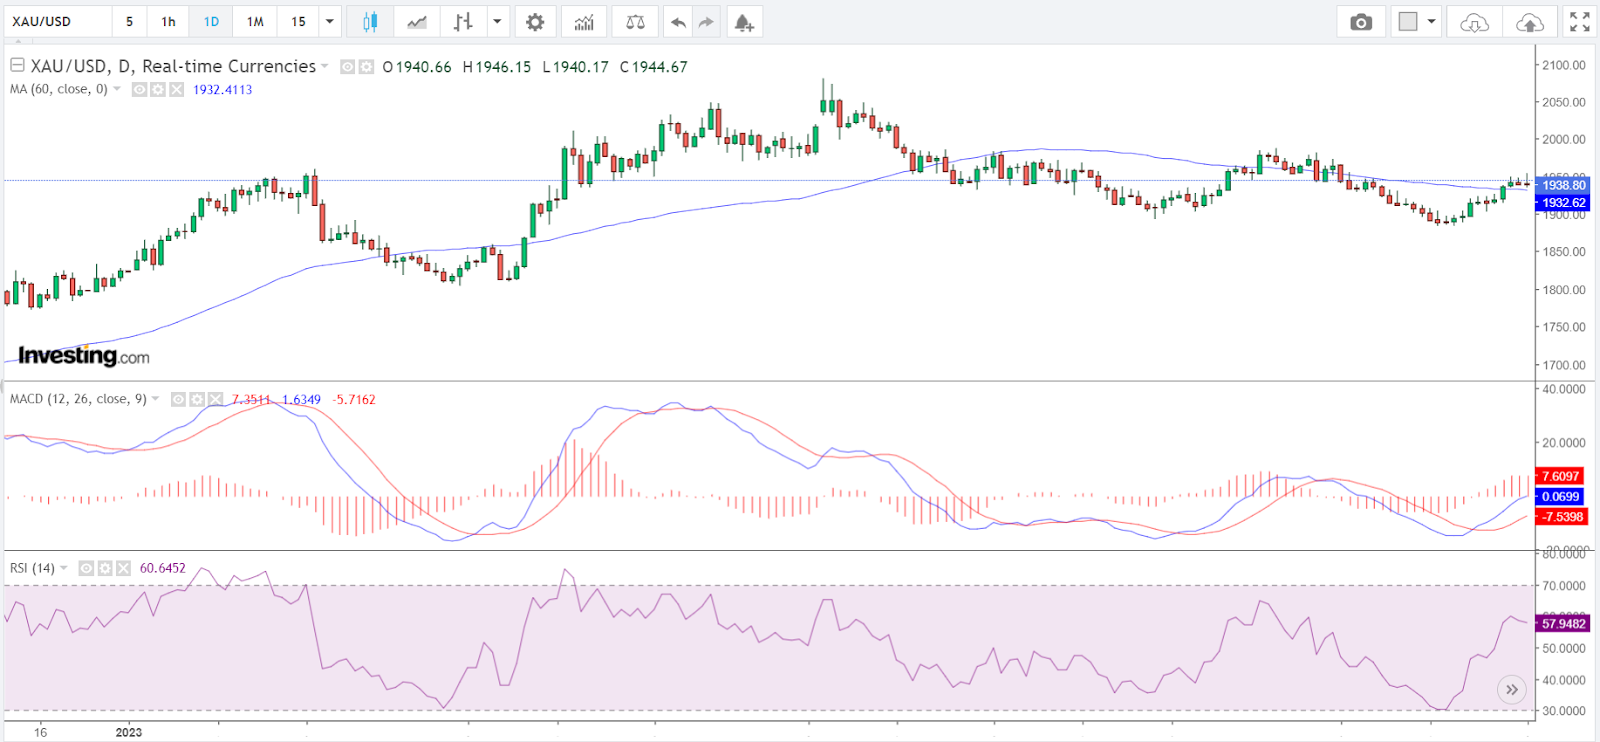
Source: Investing.com, Sep 4th Gold Daily Chart
Mitrade Analyst
Considering the analysis of various indicators, the medium to long-term downward trend in gold remains unchanged, while the short-term outlook suggests slight oscillations and upward movement. Additionally, investors should pay attention to news and economic data this week that might provide guidance on the future trends of gold, such as the US ISM Non-Manufacturing PMI, the Federal Reserve Beige Book, and speeches by Federal Reserve's Williams.
* The content presented above, whether from a third party or not, is considered as general advice only. This article should not be construed as containing investment advice, investment recommendations, an offer of or solicitation for any transactions in financial instruments.


