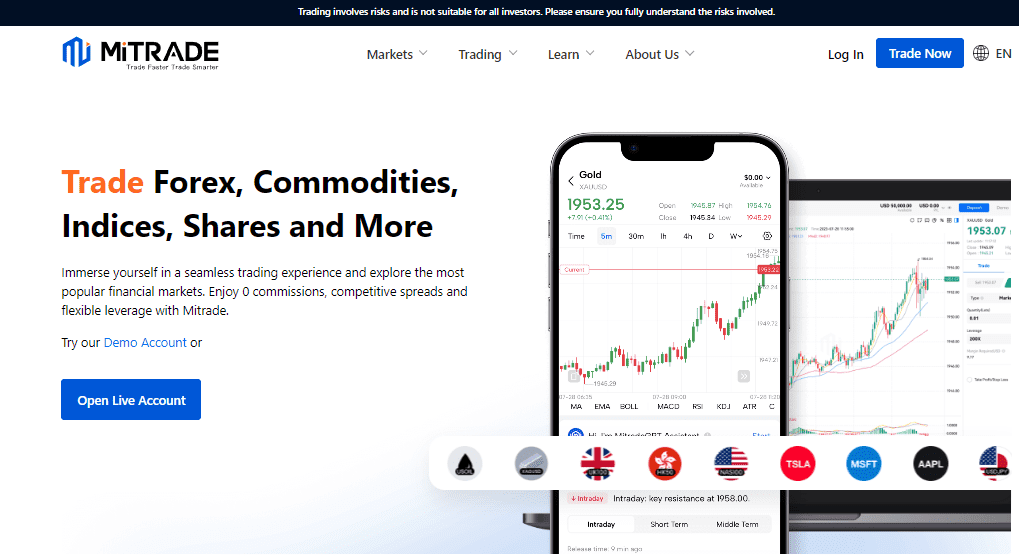
In the article "What is Mitrade ," we highlighted that Mitrade consolidates a wealth of valuable data from various providers, including, but not limited to, market quotes, charts, news, analysis, and trading tools.
As a new trader, you may not be fully acquainted with the Mitrade platform, and even experienced users might overlook certain resources. This guide aims to enhance your understanding of the essential and useful data and tools available on the platform.
1. The List of Resources on Mitrade
The table below highlights the key resources available on the official Mitrade site related to financial markets, including Forex, commodities, indices, shares, and ETFs:
Resources | Descriptions | Link |
Markets Data | The buy and sell price and price change rate | |
Forecast | Predictions for 1 Week, 1 Month, and 1 Quarter | |
Economic Calendar | Important events that affect market fundamentals | |
News | Quickly updated news | |
Analysis | In-depth analysis provided by major financial media | |
Sentiment | Market sentiment indicating buying/selling pressure | |
Education | Free resources from beginner to advanced levels |
This table provides a snapshot of the content and data resources available on the official Mitrade site. In the following sections, we will delve deeper into the data, charts, and tools provided by the Mitrade trading platform.
2. Introduction to Mitrade Trading Platform
Understanding how to effectively use the tools at your disposal is just as crucial as grasping the intricacies of the financial markets. Here, we will explore the Mitrade platform and how to navigate it.
Trading Balances | Symbols | Main Trading Window | Vertical Scale | Horizontal Scale |
P/L: The total of unrealized profit/loss and overnight fees for all open positions. Equity: The current value of the account, including the profit/loss from all open positions. Available: The amount available in the account to open new positions. Margin: The amount required to open and maintain all open positions. Margin Level: Calculated as (Equity / Margin) * 100%. | Mitrade offers a wide range of investment instruments for trading, including hundreds of Forex pairs, shares, indices, commodities, and cryptocurrencies. | This is where you can view current market movements, add your preferred indicators, and create your trade projections. | The price index display shows the current price, which will be highlighted. Traders can adjust the scales by right-clicking on the vertical scale or using the gear icon in the bottom right corner. | The date and time for the trading chart are displayed here. With the Mitrade platform, you can adjust the horizontal scale to reflect your preferred timezone. |
A more detailed view on the trading platform
Timeframes
This is the timeframe setting for the chart. It represents the duration over which data is compiled, between the opening and closing prices.
For example, when 15m is selected, each candle represents 15 minutes of price movement.
When W (weekly) is selected, each candle represents the start of the week and closes on the last day of the week.
Trading Charts
Indicators
Indicators are statistical formulas and calculations that assist traders in predicting future price movements. These indicators provide valuable insights, enabling traders to develop strategies based on them. Some popular indicators include Moving Average, Bollinger Bands, Relative Strength Index (RSI), and Moving Average Convergence Divergence (MACD).
Statistics of the candle
It displays the data of the candle that the cursor is hovering over: Open (O), High (H), Low (L), Close (C), difference from the previous candle's close price, and percentage change from the previous candle's close price.
It is important to note that if you are measuring the last or current candle, the values will still be updating until the candle closes.
Side Menu
Use the side menu to monitor your trades, deposit and withdraw funds, and manage your account settings.
Trade: Monitor the markets in real-time.
Market: A customizable dashboard to track multiple markets simultaneously.
News: Stay connected to market trends with real-time news updates.
Tutorial: Visit Mitrade Academy for comprehensive trading guides and educational materials.
Account: Manage your account information, account statement, security settings, notifications, and promotions.
3. Summary
By familiarizing yourself with these resources and tools, you can enhance your trading experience on the Mitrade platform and make more informed decisions. Happy trading!
Before making any trading decisions, it is important to equip yourself with sufficient fundamental knowledge, have a comprehensive understanding of market trends, be aware of risks and hidden costs, carefully consider investment targets, level of experience, risk appetite, and seek professional advice if necessary.
Furthermore, the content of this article is solely the author's personal opinion and does not necessarily constitute investment advice. The content of this article is for reference purposes only, and readers should not use this article as a basis for any investment decisions.
Investors should not rely on this information as a substitute for independent judgment or make decisions solely based on this information. It does not constitute any trading activity and does not guarantee any profits in trading.
If you have any inquiries regarding the data, information, or content related to Mitrade in this article, please contact us via email: insights@mitrade.com. The Mitrade team will carefully review the content to continue improving the quality of the article.


