
Gold price jumps back above $3,000 amid trade war threat to global growth
- Gold price catches fresh bids on rising global trade tensions and recession fears.
- Bets for multiple Fed rate cuts weigh on the USD and support the precious metal.
- Rising US bond yields could act as a headwind ahead of FOMC meeting minutes.
Gold price (XAU/USD) regains positive traction following the previous day's failed attempt to surpass the $3,022-3,023 hurdle and retakes the $3,000 psychological mark during the Asian session on Wednesday. Persistent worries about escalating trade tensions and fears of a recession continue to prompt investors to take refuge in the traditional safe-haven bullion. Apart from this, bets for multiple rate cuts by the Federal Reserve (Fed) this year and some follow-through US Dollar (USD) selling for the second straight day turn out to be key factors that underpin the non-yielding yellow metal.
Meanwhile, speculation that China is dumping US Treasuries in retaliation to the sweeping US tariffs led to an extended selloff in US government bonds. This might hold back traders from placing fresh bullish bets around the Gold price and cap any further gains ahead of the release of FOMC meeting minutes later this Wednesday. Investors this week will further take cues from the US inflation figures for cues about the Fed's rate-cut path, which would influence the XAU/USD. This warrants caution before confirming that the commodity's recent pullback from the all-time peak has run its course.
Daily Digest Market Movers: Gold price attracts fresh buyers as trade jitters underpin safe-haven demand
- The White House press secretary Karoline Leavitt confirmed that the US will proceed with a sweeping 104% tariff on Chinese imports starting this Wednesday. This continues to fuel worries that an all-out trade war would push the global economy into recession, which triggers a fresh wave of the risk-aversion trade and revives demand for the safe-haven Gold price.
- Investors ramped up their bets that a tariffs-driven US economic slowdown could force the Federal Reserve (Fed) to resume its rate-cutting cycle soon. In fact, the CME Group's FedWatch Tool suggests that traders are pricing in over a 60% chance that the Fed will lower borrowing costs in May. Moreover, the US central bank is expected to deliver five rate cuts in 2025.
- This, in turn, drags the US Dollar lower for the second straight day despite the overnight hawkish comments from Fed officials. In fact, San Francisco Fed President Mary Daly said on Tuesday that the policy is in a very good place and modestly restrictive. Daly further noted that inflation pressure from widespread tariffs is an increasing concern.
- Separately, Chicago Fed President Austan Goolsbee said that US tariffs are way bigger than anticipated and pose a real risk to US importers who have very few fallback options. The relationship of sentiment to spending isn't as strong as before and It's not obvious how the Fed would react to negative supply shock, Goolsbee added further.
- Investors now look forward to the release of minutes from the Fed's last policy meeting. Apart from this, the US Consumer Price Index (CPI) and the Producer Price Index (PPI) on Thursday and Friday, respectively, will be scrutinized for cues about the Fed's policy path. This, in turn, will drive the USD in the near term and influence the XAU/USD pair.
Gold price needs to surpass the $3,022-3,023 immediate hurdle to back prospects for any further gains
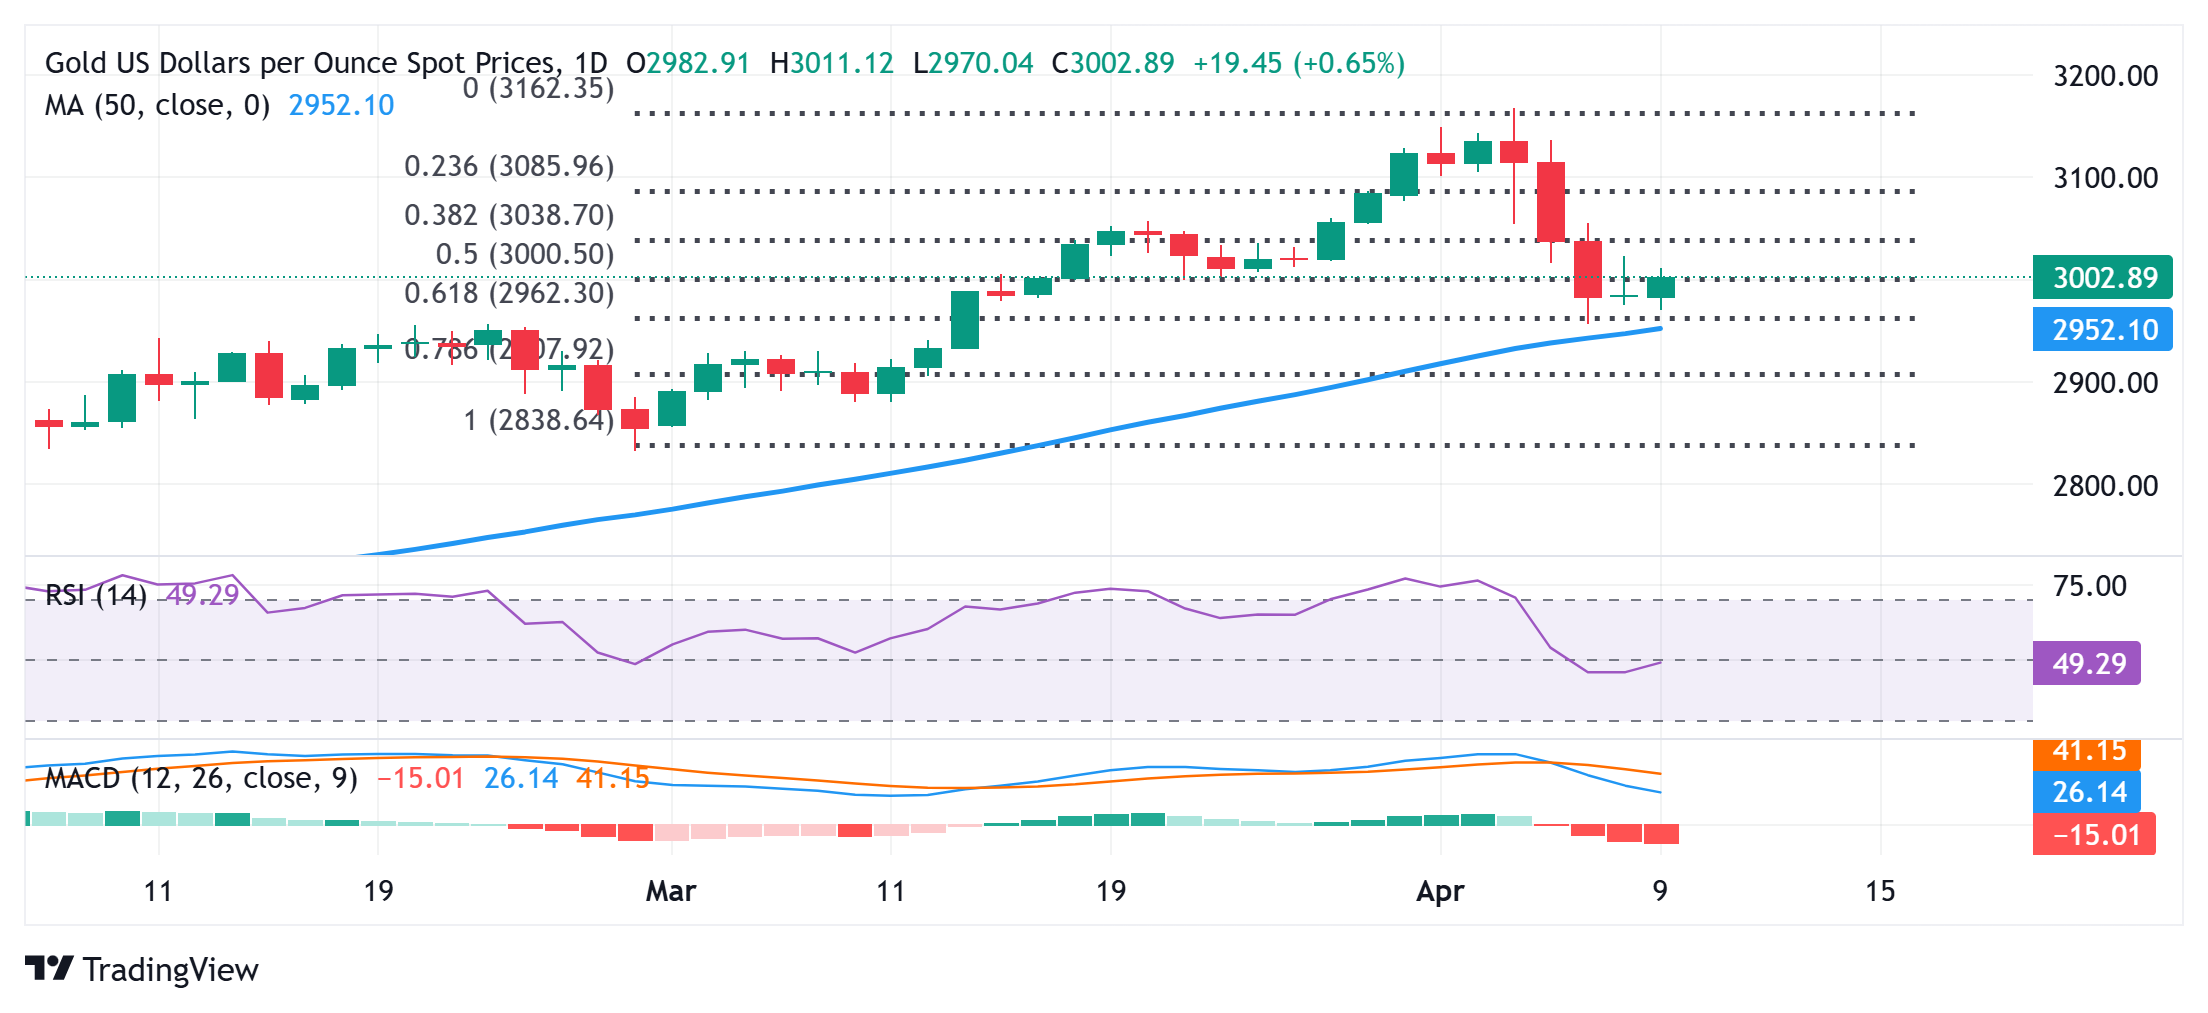
From a technical perspective, the recent sharp decline from the record high stalled near the 61.8% Fibonacci retracement level of the February-April move-up. The said support is pegged near the $2,957-2,956 area, or a multi-week low touched on Monday and is closely followed by the 50-day SMA, currently around the $2,952 region. A convincing break below the latter will be seen as a fresh trigger for bearish traders and drag the Gold price to the next relevant support near the $2,920 horizontal zone en route to the $2,900 round figure.
On the flip side, momentum beyond the overnight swing high, around the $3,023 area, could push the Gold price to the $3,055-3,056 barrier. Some follow-through buying should pave the way for a move towards reclaiming the $3,100 mark, with some intermediate hurdle near the $3,075-3.080 region.
US Dollar PRICE Today
The table below shows the percentage change of US Dollar (USD) against listed major currencies today. US Dollar was the strongest against the New Zealand Dollar.
| USD | EUR | GBP | JPY | CAD | AUD | NZD | CHF | |
|---|---|---|---|---|---|---|---|---|
| USD | -0.66% | -0.47% | -0.77% | -0.15% | -0.14% | 0.20% | -0.52% | |
| EUR | 0.66% | 0.18% | -0.16% | 0.48% | 0.58% | 0.85% | 0.12% | |
| GBP | 0.47% | -0.18% | -0.32% | 0.31% | 0.40% | 0.67% | -0.05% | |
| JPY | 0.77% | 0.16% | 0.32% | 0.61% | 0.73% | 0.99% | 0.26% | |
| CAD | 0.15% | -0.48% | -0.31% | -0.61% | 0.19% | 0.36% | -0.36% | |
| AUD | 0.14% | -0.58% | -0.40% | -0.73% | -0.19% | 0.27% | -0.45% | |
| NZD | -0.20% | -0.85% | -0.67% | -0.99% | -0.36% | -0.27% | -0.72% | |
| CHF | 0.52% | -0.12% | 0.05% | -0.26% | 0.36% | 0.45% | 0.72% |
The heat map shows percentage changes of major currencies against each other. The base currency is picked from the left column, while the quote currency is picked from the top row. For example, if you pick the US Dollar from the left column and move along the horizontal line to the Japanese Yen, the percentage change displayed in the box will represent USD (base)/JPY (quote).
Recommended Articles


