
EUR/USD Price Forecast: Sellers hold the grip as Liberation Day looms
EUR/USD Current price: 1.0786
- Upcoming US tariffs announcement on Wednesday keeps investors on their toes.
- Eurozone inflation eased modestly in March, according to preliminary estimates.
- EUR/USD under pressure below 1.0800 and poised to extend its slide.
Financial markets remain wary on Tuesday, although panic seen at the start of the week receded. The EUR/USD pair trades a handful of pips below the 1.0800 mark early in the American session, with a slight downward bias as per still finding sellers on intraday spikes.
Concerns keep revolving around United States (US) tariffs. President Donald Trump threats left and right with levies on friends and enemies, beyond the already scheduled reciprocal tariffs, set to be announced on Wednesday. US President Trump is set to announce details on the so-called Liberation Day, with speculative interest uncertain on the extend of upcoming levies.
Nevertheless, global stocks shrugged of the negative tone, and most Asian and European indexes trade in the green. Wall Street futures, however, maintains the soft tone.
Meanwhile, the Eurozone (EU) released the preliminary estimate of the March Harmonized Index of Consumer Prices (HICP), which rose at an annual pace of 2.2%, as expected, easing from the 2.3% posted in February. Core annual HICP was up 2.4% against the 2.5% expected and the previous 2.6%.
Other than that, the Hamburg Commercial Bank (HCOB) published the final estimates of the March Manufacturing Purchasing Managers’ Index (PMI) for the region, most of which suffered downward revisions. The final EU Manufacturing PMI was confirmed at 48.6 vs the previously estimated 48.7.
The upcoming American session will bring the March US ISM Manufacturing PMI and the final S&P Global estimate of manufacturing output. Additionally, the country will publish the February JOLTS Job Openings report, relevant ahead of Nonfarm Payrolls (NFP) figures scheduled for Friday.
EUR/USD short-term technical outlook
From a technical point of view, the daily chart for the EUR/USD pair shows that sellers hold the grip. The pair develops below a still bullish 20 Simple Moving Average (SMA) providing dynamic resistance at around 1.0850. At the same time, technical indicators extend their slides, although with limited downward strength. The Momentum indicator is already below its midline, in line with another leg south, while the Relative Strength Index (RSI) indicator hovers around 54. Finally, a flat 200 SMA provides support at around 1.0730.
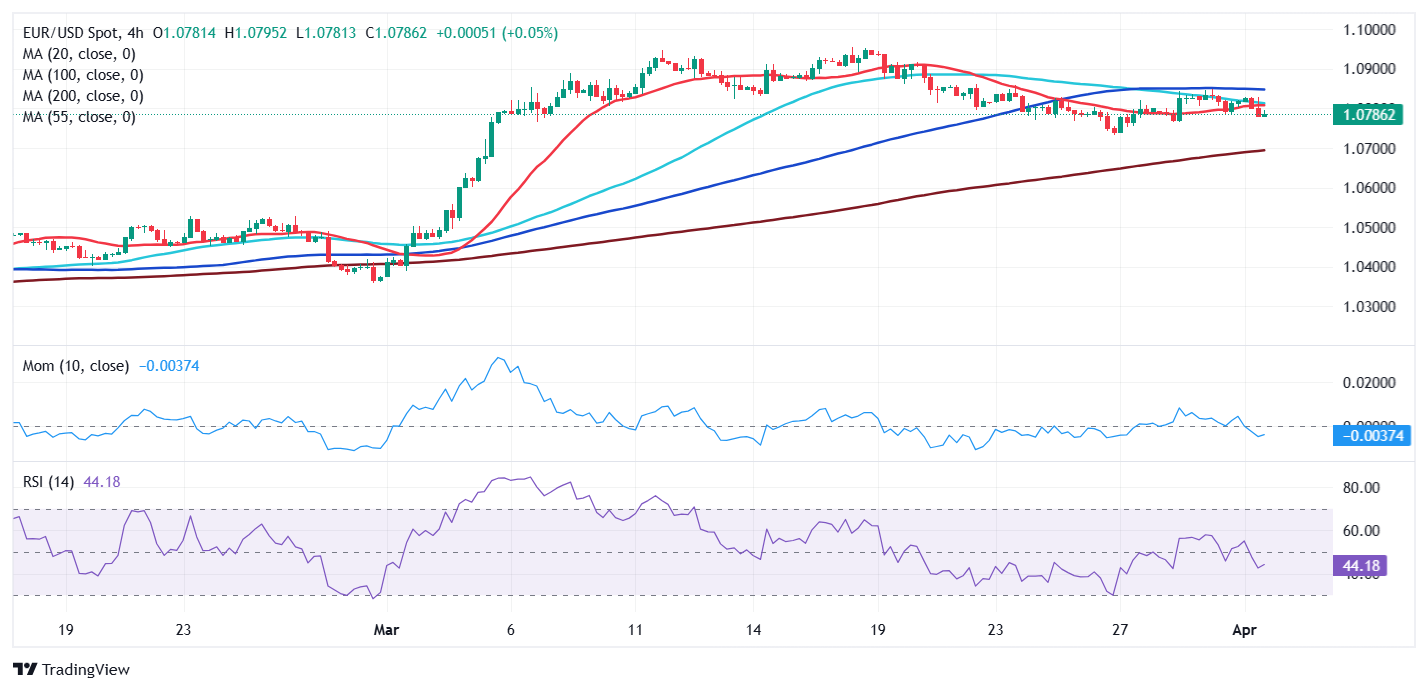
The EUR/USD pair’s 4-hour chart suggests the risk skews to the downside. The pair is actually sliding below a flat 20 SMA, while the 100 SMA acts as a weekly roof at around 1.0850. At the same time, technical indicators have turned lower, although the downward momentum is limited, while indicators stand between neutral and bearish territory. Additional slides are likely on a break below 1.0765, where buyers surged on Friday.
Support levels: 1.0765 1.0730 1.0690
Resistance levels: 10850 1.0885 1.0925
Recommended Articles


