USD/CAD price analysis: Dollar dips as political pressure mounts on the Fed

Source Fxstreet
  • USD/CAD trades near the 1.3800 area, under pressure after Trump renews criticism of the Fed.
  • Political interference concerns and tariff threats weigh heavily on the US Dollar.
  • Bearish technical indicators suggest more downside; resistance at 1.3805, 1.3934, and 1.3938.

The USD/CAD pair continues to drift lower on Monday, trading near the 1.3800 level as the US Dollar remains on the defensive following a wave of political headlines. US President Donald Trump sharply criticized Federal Reserve Chair Jerome Powell, accusing him of cutting rates for political reasons in late 2024. The renewed pressure on Fed independence comes just ahead of the central bank’s May policy meeting, with markets firmly expecting no change to the current rate.

Further complicating sentiment, Chicago Fed President Austan Goolsbee noted a rise in short-term inflation expectations, reinforcing the need for caution. Meanwhile, traders are also digesting global headlines tied to US trade policy, as the Trump administration moves forward with tariff discussions and faces pushback from major partners ahead of this week’s G20 meetings in Washington. The broader risk-off mood is favoring the Canadian Dollar, even as crude oil softens.

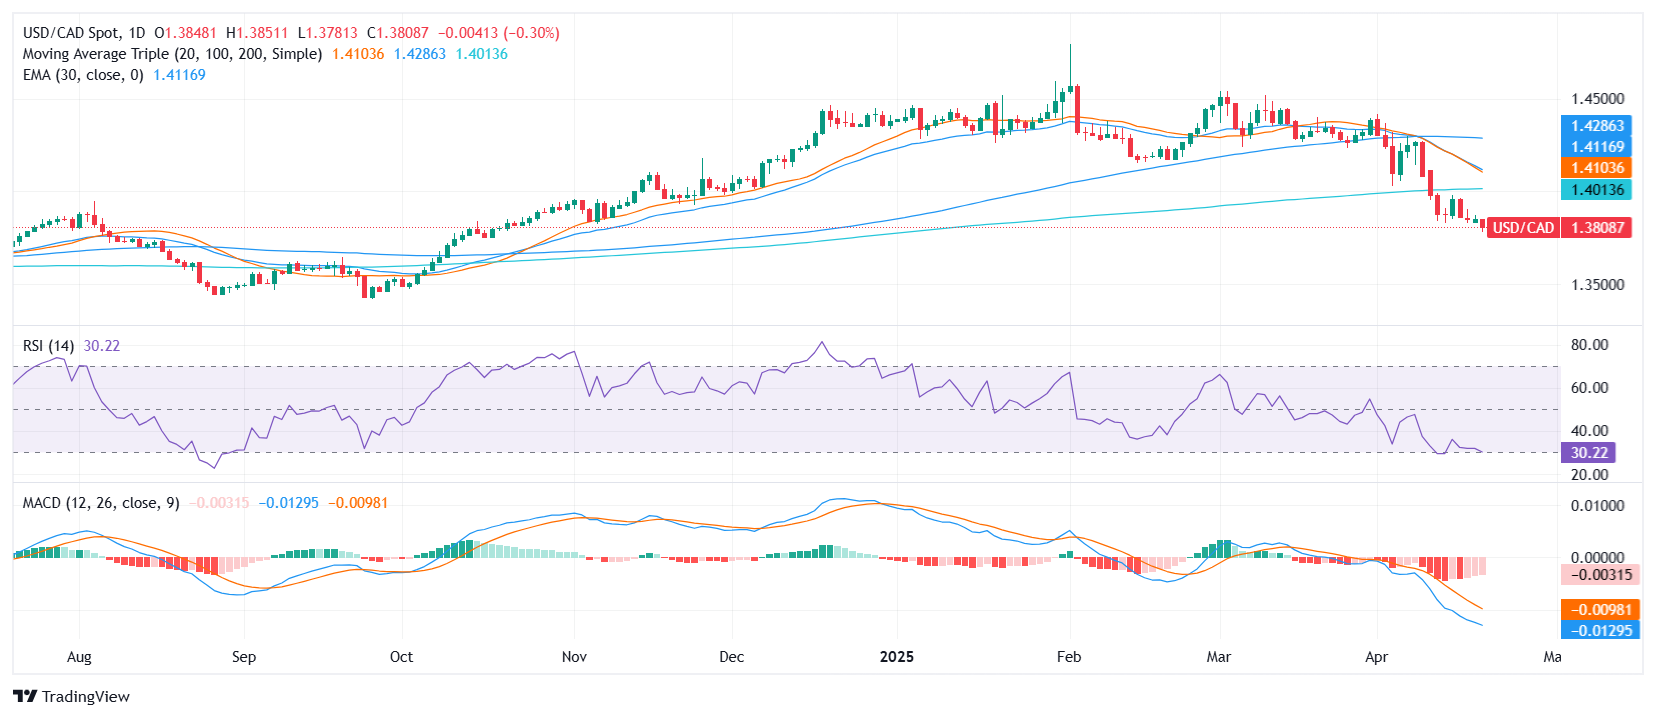
On the technical front, USD/CAD shows a bearish overall structure. Price action holds within the 1.3781–1.3852 daily range. The Relative Strength Index (RSI) reads 31, suggesting neutral momentum with a bearish tilt as it sits in the oversold threshold. The Moving Average Convergence Divergence (MACD) is flashing a sell signal, echoed by a negative Momentum (10) reading of -0.0444. Although the Awesome Oscillator remains neutral at -0.0346, the weight of the short- and long-term moving averages underscores the downside bias.

Selling pressure is supported by bearish signals from the 10-day EMA at 1.3934 and the 10-day SMA at 1.3938. Broader trend averages also lean bearish, with the 20-day SMA at 1.4103, the 100-day at 1.4278, and the 200-day at 1.4006. Immediate resistance stands at 1.3805, followed by 1.3934 and 1.3938.


Daily chart


Disclaimer: For information purposes only. Past performance is not indicative of future results.
placeholder
Bitcoin Price Breakout In Progress—Momentum Builds Above ResistanceBitcoin price is slowly moving higher above the $86,500 zone. BTC is gaining pace and might continue higher in the near term. Bitcoin found support at $84,200 and started a recovery wave. The price
Author  NewsBTC
17 hours ago
Bitcoin price is slowly moving higher above the $86,500 zone. BTC is gaining pace and might continue higher in the near term. Bitcoin found support at $84,200 and started a recovery wave. The price
placeholder
Solana Price Surges Toward $140 — Here’s The Resistance Level To WatchThe Solana price was one of the few highlights in a generally choppy crypto market over the past week. While most large-cap assets were stuck in a consolidation range in the last seven-day period,
Author  NewsBTC
17 hours ago
The Solana price was one of the few highlights in a generally choppy crypto market over the past week. While most large-cap assets were stuck in a consolidation range in the last seven-day period,
placeholder
Bitcoin’s Largest Holders Are Stacking Again — What It Means For The MarketThe Bitcoin market has shown high volatility in April, having produced similar levels of gains and losses over the past three weeks. Amidst the choppy price action, Bitcoin whales appear to be
Author  NewsBTC
17 hours ago
The Bitcoin market has shown high volatility in April, having produced similar levels of gains and losses over the past three weeks. Amidst the choppy price action, Bitcoin whales appear to be
placeholder
Bearish Case For Bitcoin: Analyst Warns Falling Wedge Is A Whale Trap That Could Drag Price To $67kBitcoin has spent the past seven days trying to hold near $85,000, with a trading range between $83,200 and $86,000. Buying momentum has turned positive in the past 24 hours, but an interesting
Author  NewsBTC
17 hours ago
Bitcoin has spent the past seven days trying to hold near $85,000, with a trading range between $83,200 and $86,000. Buying momentum has turned positive in the past 24 hours, but an interesting
placeholder
Dogecoin On The Launchpad – Analyst Calls For 500% Rally From HereInvestors in Dogecoin were sent mixed signals this week after market analysts disclosed forecasts regarding the future price action of the meme cryptocurrency. Some predict a spectacular rally, while
Author  NewsBTC
17 hours ago
Investors in Dogecoin were sent mixed signals this week after market analysts disclosed forecasts regarding the future price action of the meme cryptocurrency. Some predict a spectacular rally, while
Related Instrument
goTop
quote