
Will XRP Fall Below $2 Again?
XRP is down 5% over the past week, struggling to regain momentum as technical indicators flash mixed signals. Its Relative Strength Index (RSI) has dropped below 50, and the price remains stuck within a tight range between key support and resistance levels.
At the same time, the Ichimoku Cloud has shifted from green to red, with a thickening cloud ahead suggesting growing bearish pressure. With volatility compressing and momentum fading, XRP is nearing a critical point where a breakout—or breakdown—seems increasingly likely.
XRP Struggles to Regain Momentum as RSI Drops Below 50
XRP’s Relative Strength Index (RSI) is currently sitting at 44.54, after recovering from an intraday low of 40.67. Just yesterday, it was at 51.30, highlighting increased short-term volatility.
RSI is a momentum indicator that measures the speed and magnitude of recent price changes to evaluate overbought or oversold conditions.
Readings above 70 typically suggest an asset is overbought, while readings below 30 indicate it may be oversold.
 XRP RSI. Source: TradingView.
With XRP’s RSI at 44.54, it’s currently in neutral territory, showing neither strong buying nor selling pressure.
However, the fact that it hasn’t crossed the overbought threshold of 70 since March 19—over a month ago—signals a lack of sustained bullish momentum. This could mean XRP is still in a consolidation phase, with the market waiting for a clearer direction.
If RSI continues to climb toward 50 and beyond, it may hint at building momentum, but without a breakout above 70, upside could remain limited.
XRP Faces Uncertainty as Bearish Trend Begins to Expand
XRP is currently trading inside the Ichimoku Cloud, signaling market indecision and a neutral trend.
The Tenkan-sen (blue line) has crossed below the Kijun-sen (red line), which is a bearish signal, but with the price still within the cloud, it lacks full confirmation.
The cloud itself acts as a zone of support and resistance, and XRP is now moving sideways within that zone.
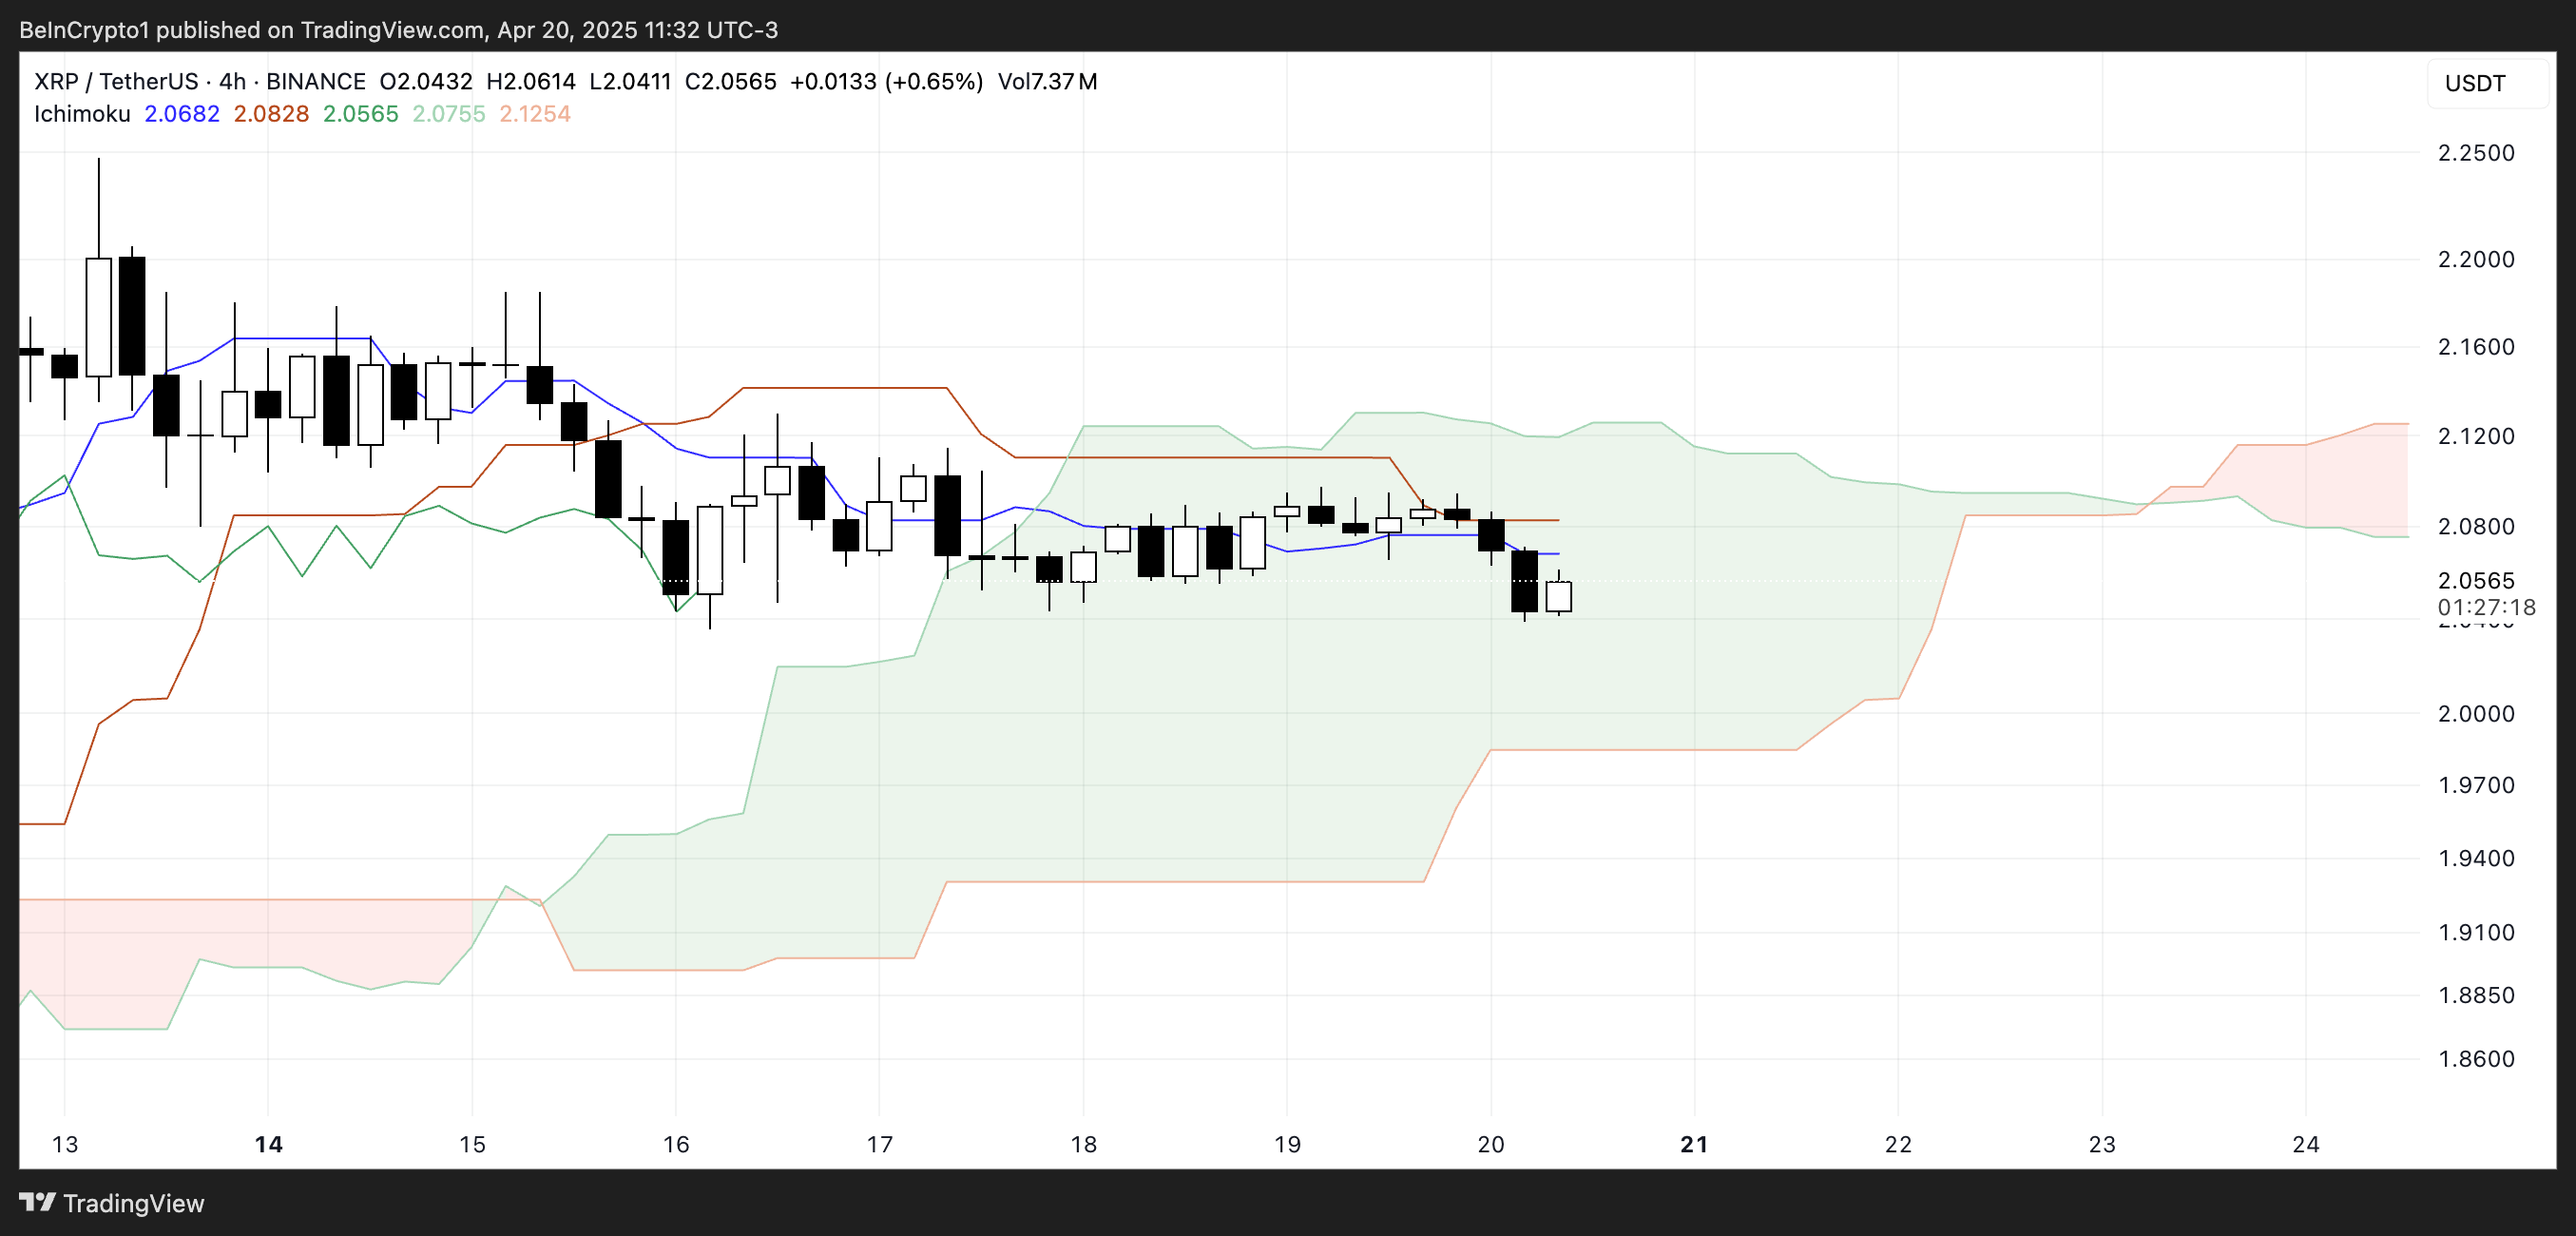 XRP Ichimoku Cloud. Source: TradingView.
Looking ahead, the cloud has shifted from green to red—a sign that bearish momentum may be building. Even more concerning is that the red cloud is widening, which suggests increasing downward pressure in the near future.
A thickening red Kumo often signals stronger resistance overhead and a potential continuation of a bearish trend if the price breaks below the cloud.
Until XRP breaks out decisively in either direction, the market remains in a wait-and-see phase, but the growing red cloud tilts the bias toward caution.
XRP Compression Zone: A Breakout Could Send Price to $2.50 — Or Much Lower
XRP price is currently trading within a tight range, caught between a key support level at $2.05 and resistance at $2.09. This narrow channel reflects short-term uncertainty, but a decisive move in either direction could set the tone for what’s next.
If the $2.05 support fails, the next level to watch is $1.96. A break below that could trigger a steep drop toward $1.61, which would mark the first close below $1.70 since November 2024—a bearish signal that could accelerate selling pressure.
Recently, veteran analyst Peter Brandt warned that a major correction could hit XRP soon.
 XRP Price Analysis. Source: TradingView.
On the flip side, if bulls regain control and push XRP above the $2.09 resistance, the next target lies at $2.17. A breakout beyond that could open the door to a move toward $2.50, a price level not seen since March 19.
For that to happen, XRP would need a clear resurgence in momentum and buying volume.
Until then, the price remains trapped in a narrow zone, with both upside and downside potential on the table.
Recommended Articles


