Chainlink Price Forecast: LINK holders bought into recent price dips

Source Fxstreet
  • Chainlink price retests and finds support around its descending trendline at $16.91, while eyeing a recovery ahead.
  • On-chain data paints a bullish picture as LINK’s daily active addresses and revenue generated are rising.
  • Supply Distribution data shows that two cohorts of whales bought LINK during the recent price dip.

Chainlink (LINK) price is retesting and finding support around its descending trendline throwback at $16.91 this week, eyeing a recovery ahead. On-chain data supports the recovery as LINK’s daily active addresses and revenue generated are rising. Moreover, LINK’s Supply Distribution data shows that two cohorts of whales bought LINK during the recent price dip, hinting at a recovery ahead.

LINK holders bought the dips

Santiment’s Supply Distribution metric shows that the whales holding LINK tokens between 1 million and 10 million dropped from 195 million on Saturday to 190.72 million on Wednesday. Meanwhile, wallets holding 100,000 to 1 million and 10 million to 100 million surged from 155.31 million to 159.53 million and 479 million to 480.78 million, respectively, in the same period.

This development shows that the first cohort of whales could have fallen prey to the capitulation event. In contrast, the second set of wallets seized the opportunity and accumulated Chainlink at a discount during the recent price dip, bolstering investors’ confidence in LINK.

Chainlink supply distribution chart. Source: Santiment 

Chainlink supply distribution chart. Source: Santiment 

Another aspect bolstering the platform’s bullish outlook is a recent surge in Chainlink blockchain usage. Token terminal data shows that LINK’s daily active addresses rose from 2,900 on Saturday to 6,300 on Monday, the highest level since December 13.
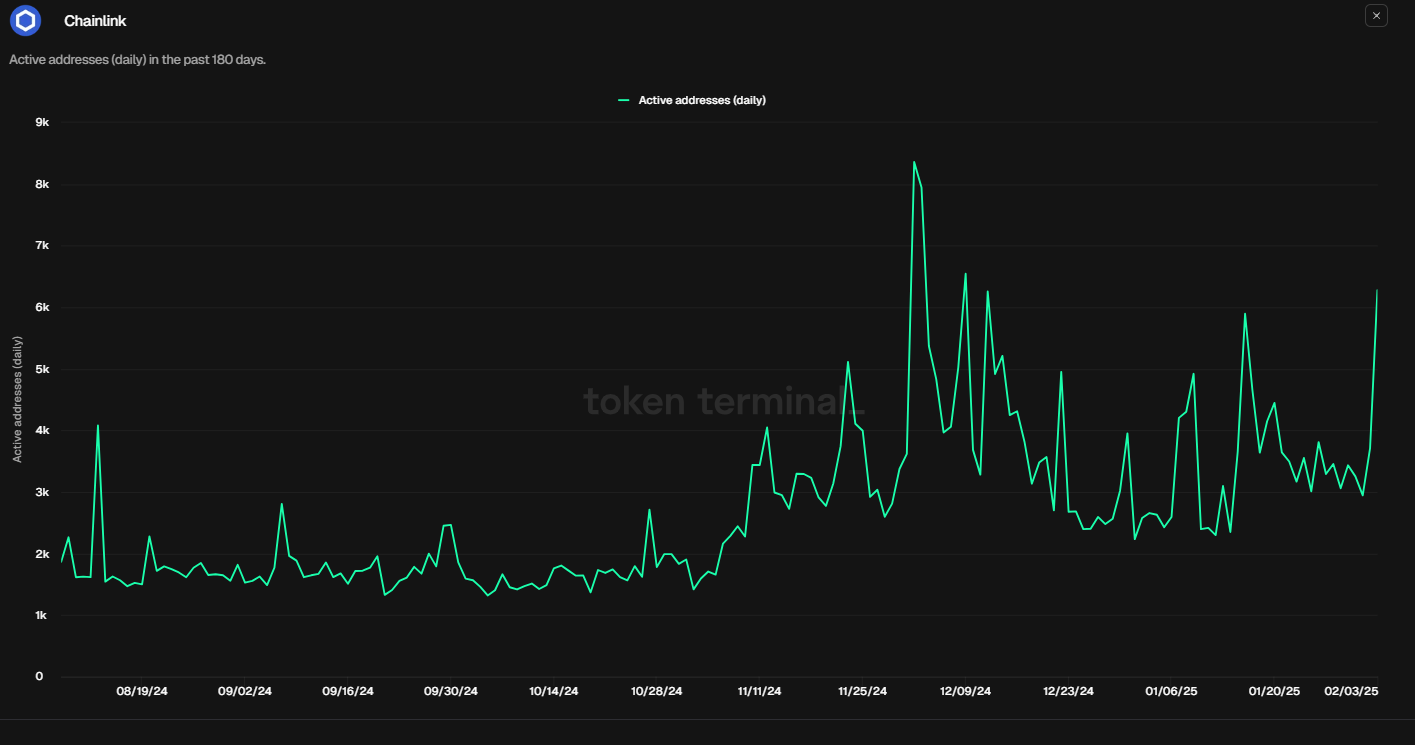
LINK active addresses chart. Source: Token Terminal

LINK active addresses chart. Source: Token Terminal

Additionally, Token Terminal data shows that LINK generated $4.5k in revenue on Monday, the highest daily revenue collected since December 21, further bolstering the bullish outlook.
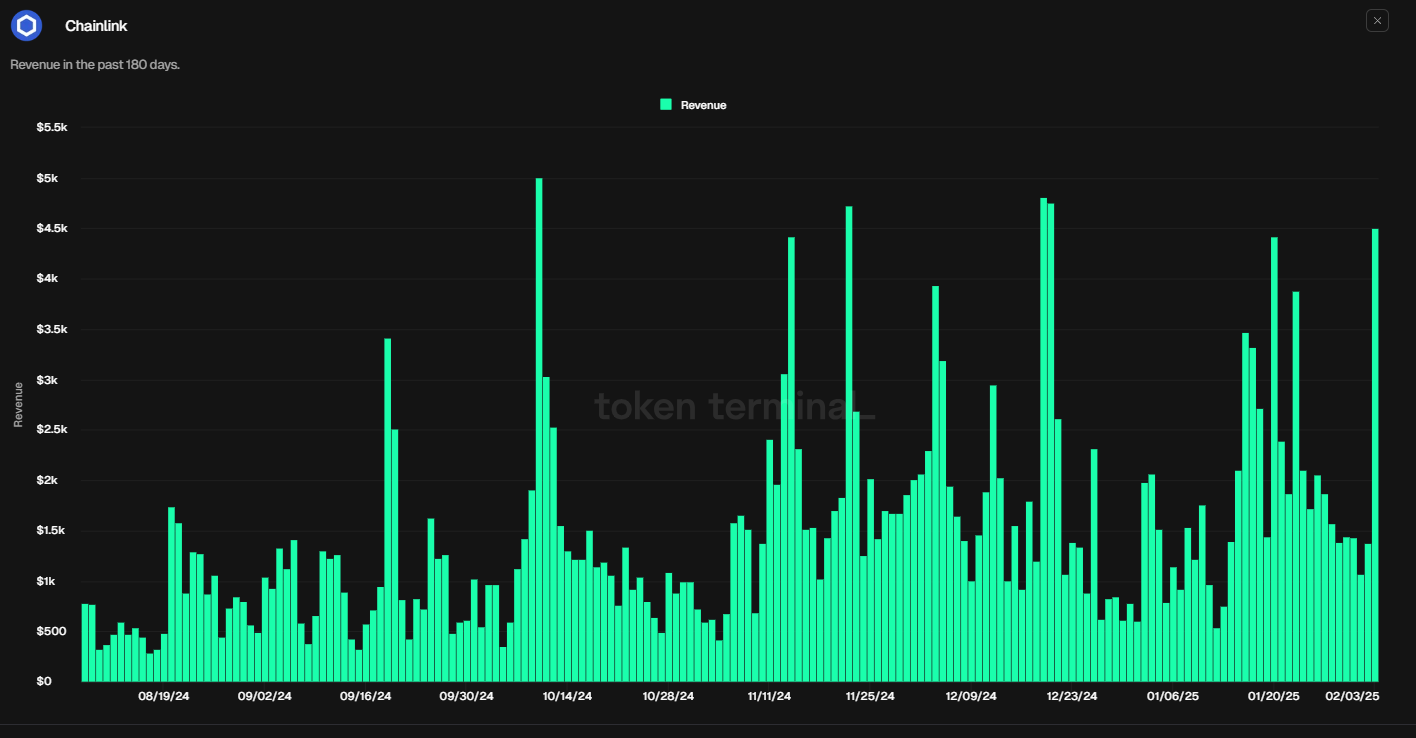
Chainlink Revenue chart. Source: Token Terminal

Chainlink Revenue chart. Source: Token Terminal

Chainlink Price Forecast: LINK retests its descending trendline throwback support 

Chainlink price declined more than 17% in the previous week. At the start of this week, it retested, found support around its descending trendline (drawn by joining multiple highs since early November 2021) throwback, and is trading around $19.88 on Wednesday. This descending trendline roughly coincides with the 50-day Exponential Moving Average (EMA) at $18.88, making this level a key reversal zone. 

If the descending trendline supports, LINK will extend the rally toward its December 13 high of $31.20.

The weekly chart's Relative Strength Index (RSI) reads 52, above its neutral level, indicating bullish momentum. However, the Moving Average Convergence Divergence (MACD) indicator is about to trigger a bearish crossover on the weekly chart. Traders should be cautious as a bearish crossover suggests a downward trend.
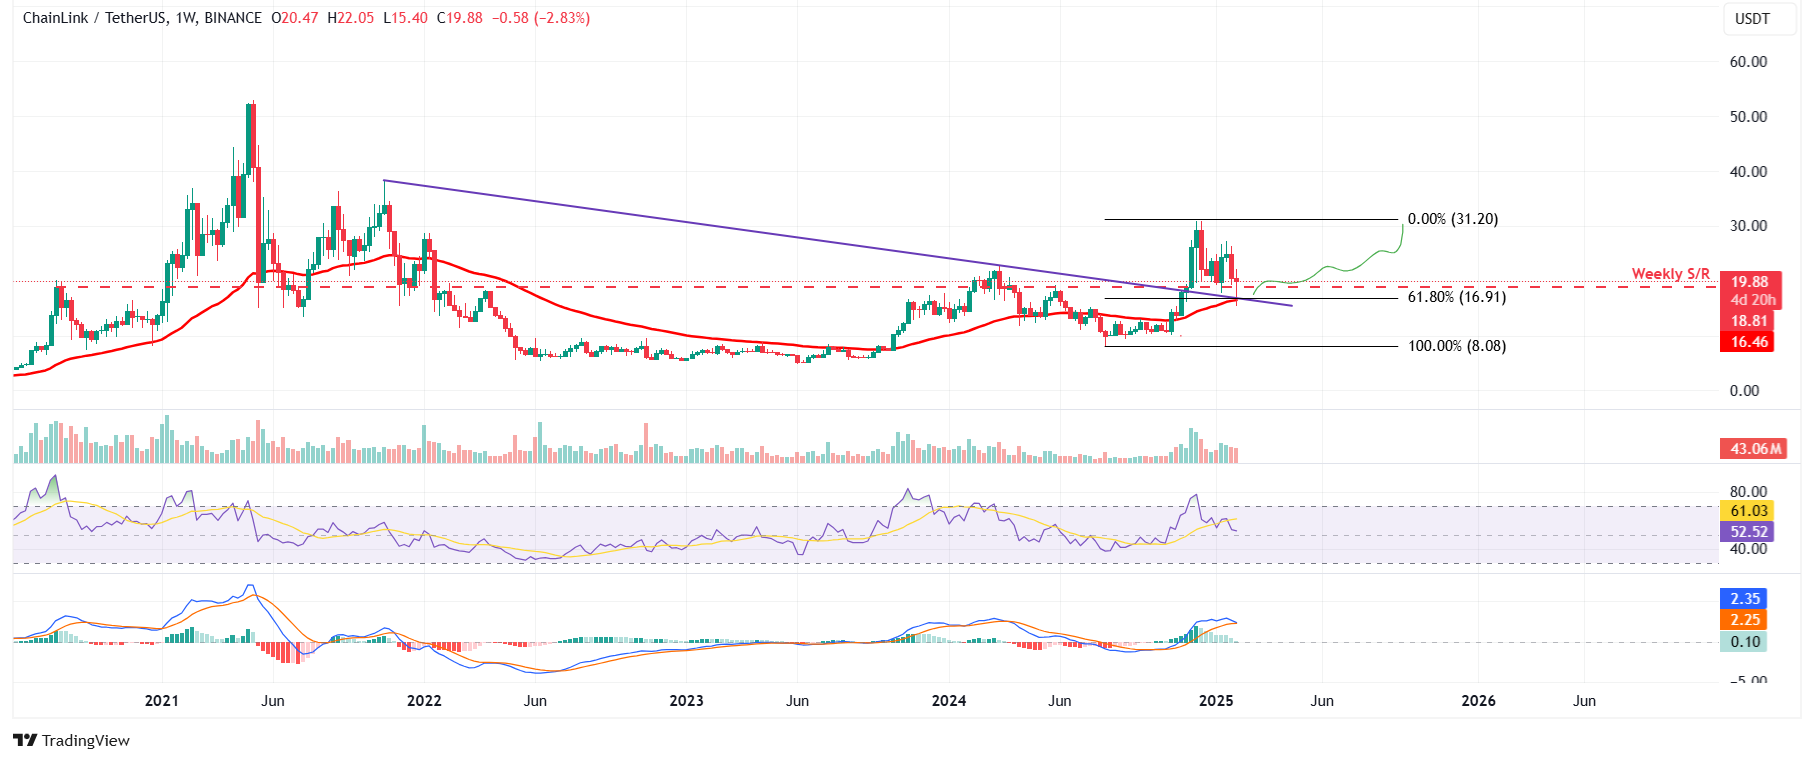
LINK/USDT weekly chart

LINK/USDT weekly chart

Disclaimer: For information purposes only. Past performance is not indicative of future results.
placeholder
Dogecoin and Bitcoin Cash Price Prediction: Funding rates decrease indicate weakness in DOGE and BCHDogecoin (DOGE) and Bitcoin Cash (BCH) registered 3% and 8% losses on Tuesday following increased selling pressure from the futures market. The decline comes amid large-cap cryptos like Bitcoin (BTC), Ether (ETH) and XRP, holding still with slight gains.
Author  FXStreet
Yesterday 06: 13
Dogecoin (DOGE) and Bitcoin Cash (BCH) registered 3% and 8% losses on Tuesday following increased selling pressure from the futures market. The decline comes amid large-cap cryptos like Bitcoin (BTC), Ether (ETH) and XRP, holding still with slight gains.
placeholder
Gold price holds above $3,200; bullish bias remains amid trade uncertaintyGold price (XAU/USD) attracts some dip-buyers following the previous day's modest pullback from the record high and trades comfortably above the $3,200 mark during the Asian session on Tuesday.
Author  FXStreet
Yesterday 06: 16
Gold price (XAU/USD) attracts some dip-buyers following the previous day's modest pullback from the record high and trades comfortably above the $3,200 mark during the Asian session on Tuesday.
placeholder
Ripple Price Prediction: Exchange inflows surge as XRP slides, what comes next?Ripple (XRP) corrected along with other major digital assets, including Bitcoin (BTC) and Ethereum (ETH), and traded at $2.08 at the time of writing on Wednesday. The drawdown cut across the crypto market, causing the total capitalization to drop 3.2% to $2.736 trillion.
Author  FXStreet
6 hours ago
Ripple (XRP) corrected along with other major digital assets, including Bitcoin (BTC) and Ethereum (ETH), and traded at $2.08 at the time of writing on Wednesday. The drawdown cut across the crypto market, causing the total capitalization to drop 3.2% to $2.736 trillion.
placeholder
Gold price buying remains unabated; fresh all-time high and counting amid trade jittersGold price (XAU/USD) scales higher for the second straight day on Wednesday – also marking the fifth day of a positive move in the previous six – and touches a fresh record high, around the $3,283-3,284 area during the Asian session.
Author  FXStreet
6 hours ago
Gold price (XAU/USD) scales higher for the second straight day on Wednesday – also marking the fifth day of a positive move in the previous six – and touches a fresh record high, around the $3,283-3,284 area during the Asian session.
placeholder
EUR/USD rises to near 1.1350 ahead of Eurozone HICP inflation dataEUR/USD is trading around 1.1340 during the Asian hours on Wednesday, rebounding after two consecutive sessions of losses.
Author  FXStreet
6 hours ago
EUR/USD is trading around 1.1340 during the Asian hours on Wednesday, rebounding after two consecutive sessions of losses.
Related Instrument
goTop
quote