Altcoins Tron and Toncoin Price Prediction: TRX and TON show signs of weakness

Source Fxstreet
  • Tron and Toncoin prices extend the decline on Thursday after falling more than 6% this week.
  • TRX and TON face rejection from key levels, suggesting double-digit cash ahead.
  • Traders should be cautious as both altcoins show signs of weakness in momentum indicators.

Tron (TRX) and Toncoin (TON) prices extend their decline on Thursday after falling more than 6% this week. TRX and TON prices faced rejection from key levels, suggesting double-digit cash ahead. Furthermore, the technical outlook also supports a bearish trend as both altcoins show signs of weakness in momentum indicators.

Tron Price Forecast: Poised for a double-digit crash

Tron price faced rejection at the 61.8% Fibonacci retracement on Tuesday (drawn from the November 7 low of $0.159 to the December 4 high of $0.450) at $0.270 and declined 6.67% until Wednesday. At the time of writing on Thursday, it trades down around $0.244, below its 50-day Exponential Moving Average (EMA) support level of $0.248.

If TRX closes below the 50-day EMA at $0.248, it could extend the decline by 16.8% to test its December 2 low of $0.203.

The Relative Strength Index (RSI) reads 42, below its neutral level of 50, and points downwards, indicating strong bearish momentum. Additionally, the Moving Average Convergence Divergence (MACD) indicator also shows a bearish crossover on Tuesday, suggesting a sell signal and a downtrend. 
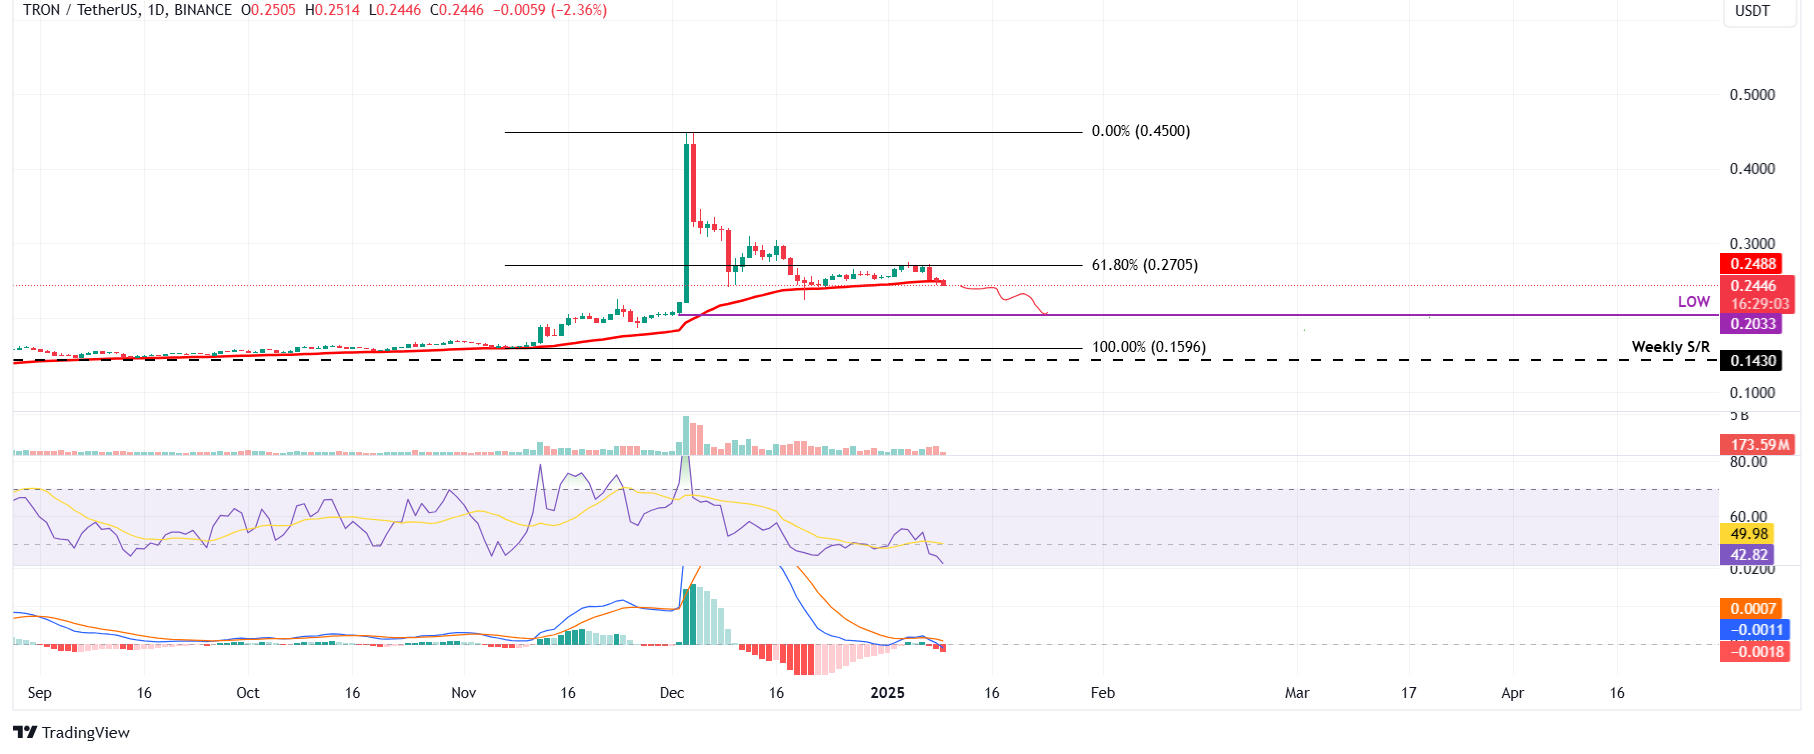
TRX/USDT daily chart

TRX/USDT daily chart

Toncoin price action shows signs of bearish momentum 

Toncoin price was rejected from the 50-day EMA level of $5.72 on Tuesday and declined by 7% until Wednesday. At the time of writing on Thursday, it continues to edge down, trading around $5.20.

If TON continues its downward trend, it could extend the decline by 11.5% from its current level to retest its next daily support at $4.60.

Like TRX, Tron’s RSI indicator trades below its neutral level of 50 and points downwards, indicating strong bearish momentum. Moreover, the MACD shows a bearish crossover on Tuesday. 
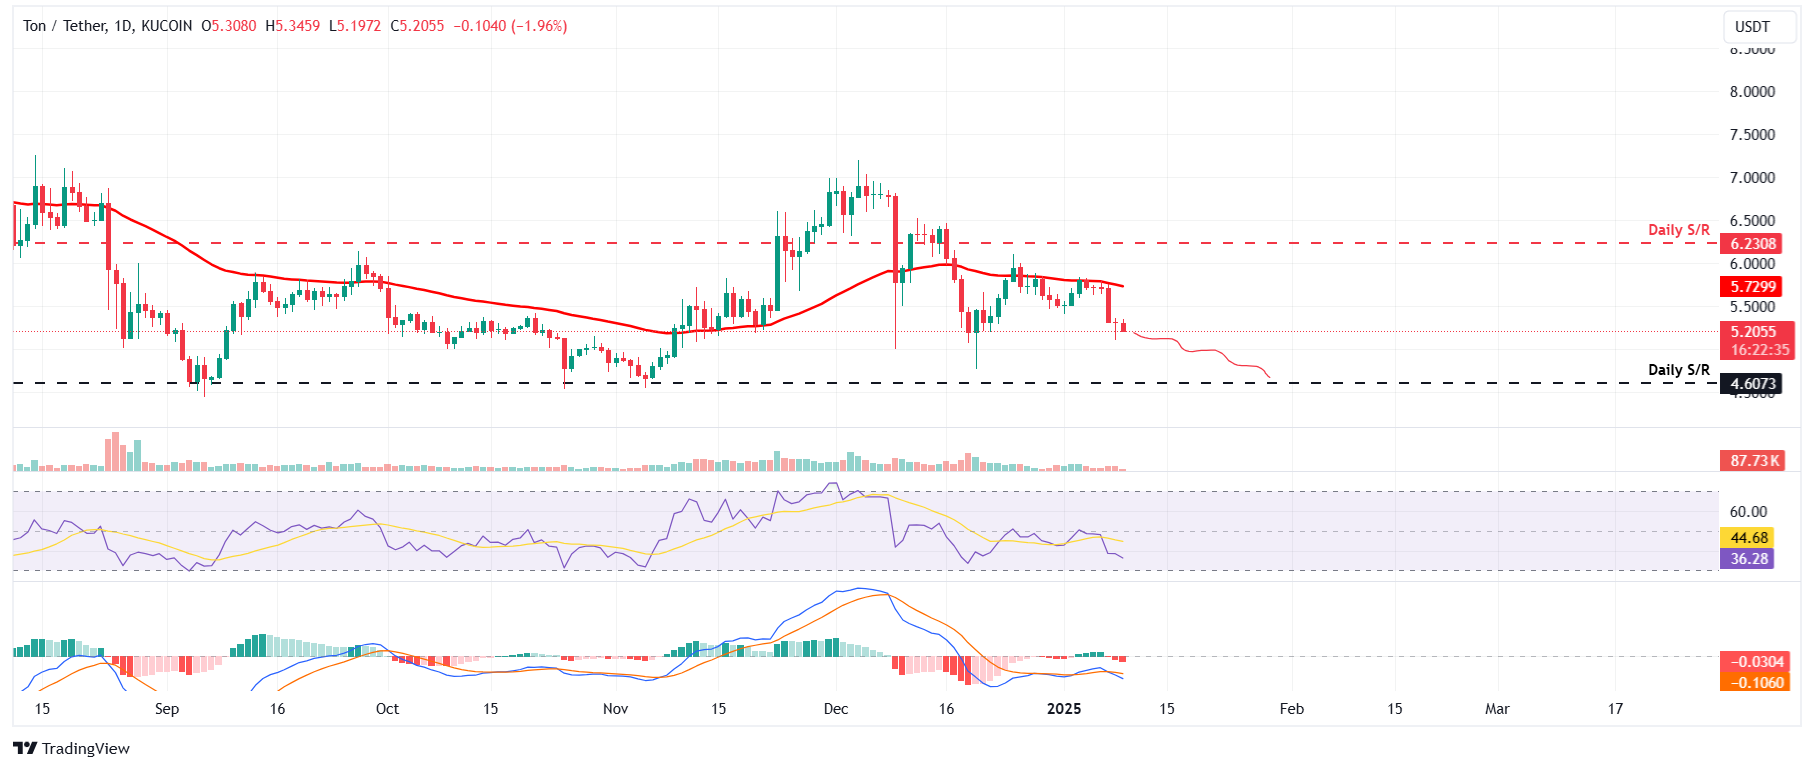
TON/USDT daily chart

TON/USDT daily chart

Disclaimer: For information purposes only. Past performance is not indicative of future results.
placeholder
Gold Price Forecast: XAU/USD retreats further from all-time highs of $3,245 Gold price is back in the red early Monday, snapping a three-day record rally to lifetime highs of $3,245 set on Friday.    
Author  FXStreet
4 Month 14 Day Mon
Gold price is back in the red early Monday, snapping a three-day record rally to lifetime highs of $3,245 set on Friday.    
placeholder
GBP/USD climbs further beyond 1.3200, highest since October ahead of UK jobs dataThe GBP/USD pair attracts buyers for the sixth straight day and climbs above the 1.3200 mark, hitting a fresh high since October 2024 during the Asian session on Tuesday.
Author  FXStreet
4 Month 15 Day Tue
The GBP/USD pair attracts buyers for the sixth straight day and climbs above the 1.3200 mark, hitting a fresh high since October 2024 during the Asian session on Tuesday.
placeholder
BNB Price Reclaims $600 — Is This the Start of a Major Upside Move?BNB price is rising from the $580 support zone. The price is now consolidating gains above $600 and might aim for more gains in the near term. BNB price is attempting to recover above the $615
Author  FXStreet
4 Month 23 Day Wed
BNB price is rising from the $580 support zone. The price is now consolidating gains above $600 and might aim for more gains in the near term. BNB price is attempting to recover above the $615
placeholder
Gold Price Forecast: XAU/USD edges lower to near $3,300 as US-China trade tensions easeThe Gold price (XAU/USD) drifts lower to around $3,310 during the early Asian session on Monday. The precious metal retreats after hitting its record high last week amid signs that global trade tensions may be easing.
Author  FXStreet
Yesterday 03: 38
The Gold price (XAU/USD) drifts lower to around $3,310 during the early Asian session on Monday. The precious metal retreats after hitting its record high last week amid signs that global trade tensions may be easing.
placeholder
Dogecoin Confirms Daily Trend Reversal With Breakout, Retest And New UptrendDogecoin’s price is entering a new bullish phase after months of decline. Technical analysis of the daily candlestick timeframe chart shows that the popular meme cryptocurrency is flashing a
Author  NewsBTC
Yesterday 03: 41
Dogecoin’s price is entering a new bullish phase after months of decline. Technical analysis of the daily candlestick timeframe chart shows that the popular meme cryptocurrency is flashing a
Related Instrument
goTop
quote