AUD/JPY Price Analysis: Struggles to hold ground ahead of the Asian session

Source Fxstreet
  • The AUD/JPY trades near the 91.30 zone with minimal gains during Monday’s session.
  • Overall bias remains bearish despite mixed technical signals.
  • Key resistance lies near 91.80, while support is seen closer to 91.10.

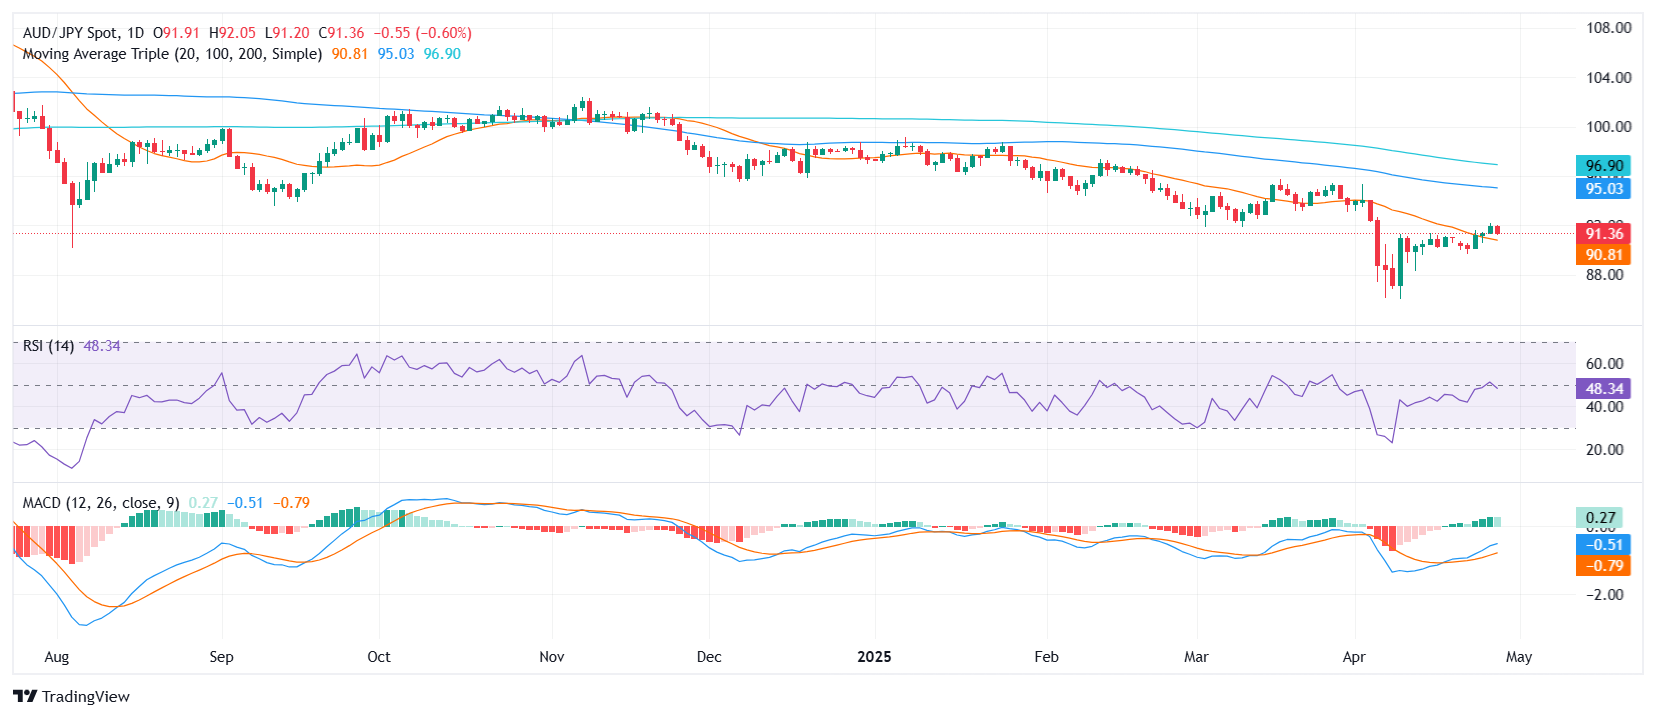
The AUD/JPY is trading close to the 91.30 area on Monday, showing very limited movement ahead of the Asian session. The pair remains stuck mid-range after a session characterized by low volatility. Despite a marginal daily gain, technical indicators provide a mixed picture: the Relative Strength Index (RSI) stays neutral around 48, the Moving Average Convergence Divergence (MACD) flashes a buy signal, while momentum and stochastic oscillators hint at mounting selling pressure. A bearish tilt remains dominant, reinforced by the 30-day Exponential Moving Average (EMA) and Simple Moving Average (SMA), as well as the 100-day and 200-day SMAs, all indicating further downside risks.

Looking deeper into the technical setup, selling signals persist as the 30-day EMA at 91.77 and 30-day SMA at 91.88 lean toward further declines. Longer-term trends also add to the bearish bias, with the 100-day SMA at 94.99 and the 200-day SMA at 96.92 firmly indicating selling pressure. Even though the 20-day SMA, positioned lower around 90.65, suggests short-term buying interest, it seems insufficient to overturn the broader negative sentiment.

Momentum indicators bolster the bearish case, with the 10-period momentum showing weakness and the stochastic %K hovering at elevated but downward-leaning levels near 86, typically a signal of potential reversal from overbought conditions. On the flip side, the MACD’s buy signal tempers the bearish outlook somewhat, hinting at possible short-term stabilization.

In terms of levels to watch, support is seen around 91.33, 91.13, and deeper near 90.98. Meanwhile, resistance is stacked near the 91.77, 91.81, and 91.88 zones, suggesting that any upside attempt could face challenges relatively quickly.

Daily chart
Disclaimer: For information purposes only. Past performance is not indicative of future results.
placeholder
BNB Price Reclaims $600 — Is This the Start of a Major Upside Move?BNB price is rising from the $580 support zone. The price is now consolidating gains above $600 and might aim for more gains in the near term. BNB price is attempting to recover above the $615
Author  FXStreet
4 Month 23 Day Wed
BNB price is rising from the $580 support zone. The price is now consolidating gains above $600 and might aim for more gains in the near term. BNB price is attempting to recover above the $615
placeholder
Ethereum Price Reaches Last H1 Support, Next Major Resistance Comes Into ViewEthereum, the second-largest cryptocurrency, has increased by 12.3% over the past seven days. Interestingly, Ethereum has held its ground firmly, supported by a clean uptrend that began after the
Author  NewsBTC
4 Month 27 Day Sun
Ethereum, the second-largest cryptocurrency, has increased by 12.3% over the past seven days. Interestingly, Ethereum has held its ground firmly, supported by a clean uptrend that began after the
placeholder
Dow Jones dips as trade uncertainty lingers, consumer sentiment sinksThe Dow Jones Industrial Average (DJIA) registered losses of over 0.32% on Friday amid uncertainty over the trade war between the US and China.
Author  FXStreet
4 Month 27 Day Sun
The Dow Jones Industrial Average (DJIA) registered losses of over 0.32% on Friday amid uncertainty over the trade war between the US and China.
placeholder
Gold Price Forecast: XAU/USD edges lower to near $3,300 as US-China trade tensions easeThe Gold price (XAU/USD) drifts lower to around $3,310 during the early Asian session on Monday. The precious metal retreats after hitting its record high last week amid signs that global trade tensions may be easing.
Author  FXStreet
22 hours ago
The Gold price (XAU/USD) drifts lower to around $3,310 during the early Asian session on Monday. The precious metal retreats after hitting its record high last week amid signs that global trade tensions may be easing.
placeholder
Dogecoin Confirms Daily Trend Reversal With Breakout, Retest And New UptrendDogecoin’s price is entering a new bullish phase after months of decline. Technical analysis of the daily candlestick timeframe chart shows that the popular meme cryptocurrency is flashing a
Author  NewsBTC
22 hours ago
Dogecoin’s price is entering a new bullish phase after months of decline. Technical analysis of the daily candlestick timeframe chart shows that the popular meme cryptocurrency is flashing a
Related Instrument
goTop
quote