


AUD/JPY Price Analysis: Gains capped near key resistance as bearish backdrop persists
- AUD/JPY trades near the 90.30 zone after modest gains on Friday
- Momentum remains weak as indicators lean neutral-to-bearish
- Resistance at 90.86 and bearish pressure from key moving averages limit upside
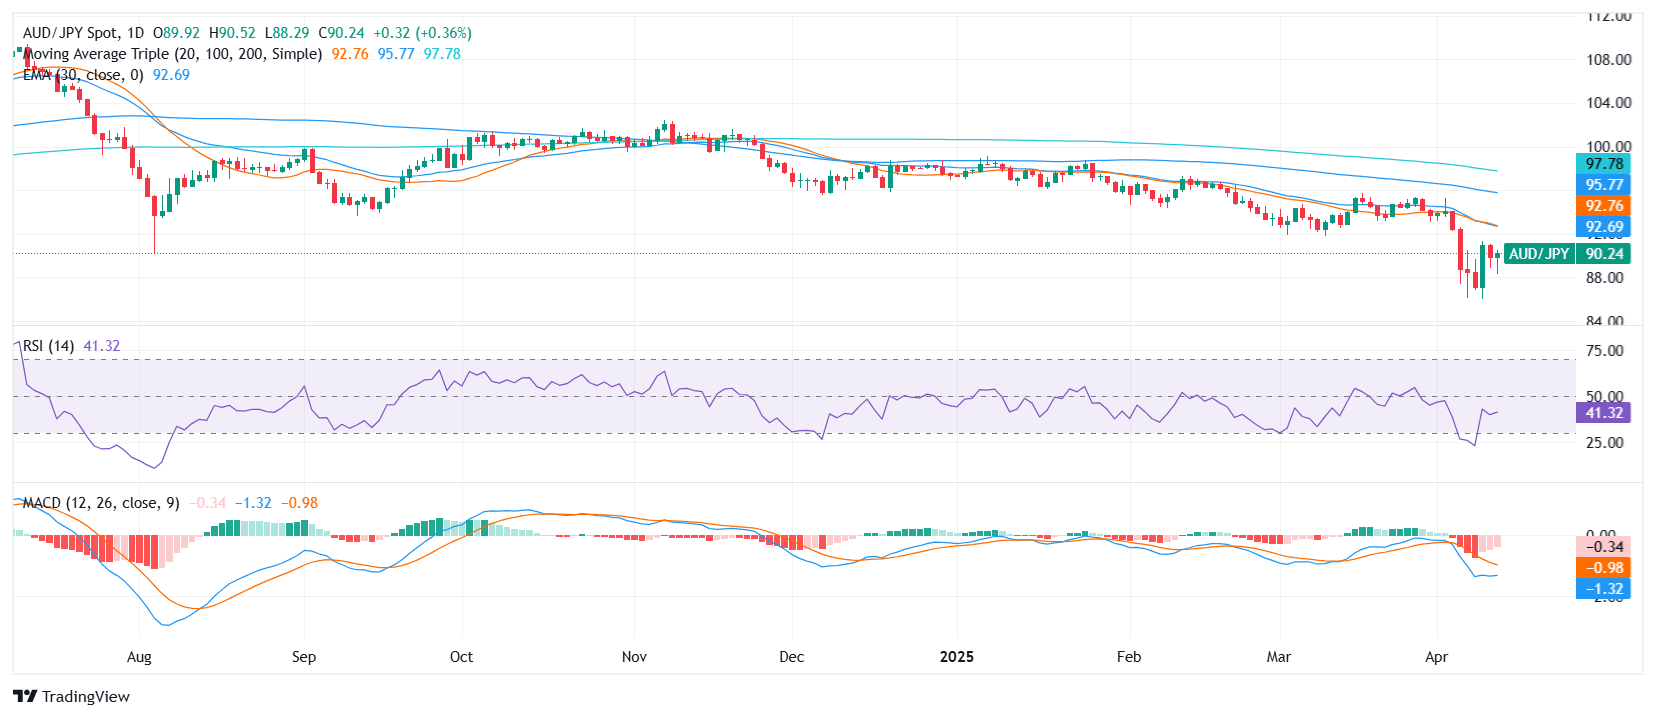
The AUD/JPY pair posted a mild advance on Friday’s session, moving toward the 90.30 zone after notching a gain of over 0.30%. Despite the intraday rise, the overall technical picture remains bearish, with the pair still struggling beneath several key resistance levels and longer-term moving averages.
While price action approached the top of the daily range (88.287–90.516), momentum indicators reveal limited conviction behind the move. The Relative Strength Index (RSI) remains neutral at 42.156, while the MACD continues to flash a sell signal. Similarly, both the Bull Bear Power (-3.748) and Commodity Channel Index (CCI) at -92.800 offer neutral reads, pointing to a potential loss of bullish traction.
Trend-based indicators continue to favor sellers. The 20-day simple moving average (SMA) at 92.780, along with the 100-day SMA at 95.861 and the 200-day SMA at 97.903, all tilt downward. Bearish signals are further confirmed by the 10-day exponential moving average (EMA) at 90.867 and 10-day SMA at 90.985.
Looking ahead, support is seen at 89.341, with resistance levels aligned at 90.867, 90.899, and 90.985. A sustained break above this confluence would be needed to weaken the current bearish bias, though the broader trend remains under pressure.
Daily chart
Recommended Articles


