


Uniswap price hovers around $5.92 on Thursday after rallying 12.8% so far this week.
According to Wu Blockchain, data shows the address transferred 9 million UNI to the Coinbase Prime Deposit on Thursday.
Traders should exercise caution, as such transfers could trigger volatility in UNI.
Uniswap (UNI) price hovers around $5.92 at the time of writing on Thursday, having rallied 12.8% so far this week. According to Wu Blockchain, data shows that the address potentially related to the Uniswap team, investor, or advisor transferred 9 million UNI to the Coinbase Prime Deposit on Thursday. Traders should exercise caution, as such transfers could trigger volatility in UNI.
Uniswap whale wallet moves nearly $54 million
Wu Blockchain’s X post on Thursday indicates that an address potentially associated with the Uniswap team, investor, or advisor transferred 9 million UNI worth $53.91 million to the Coinbase Prime Deposit on the same day.
According to CoinGecko data, this token transfer represents approximately 1.5% of the current circulating supply of 600 million.
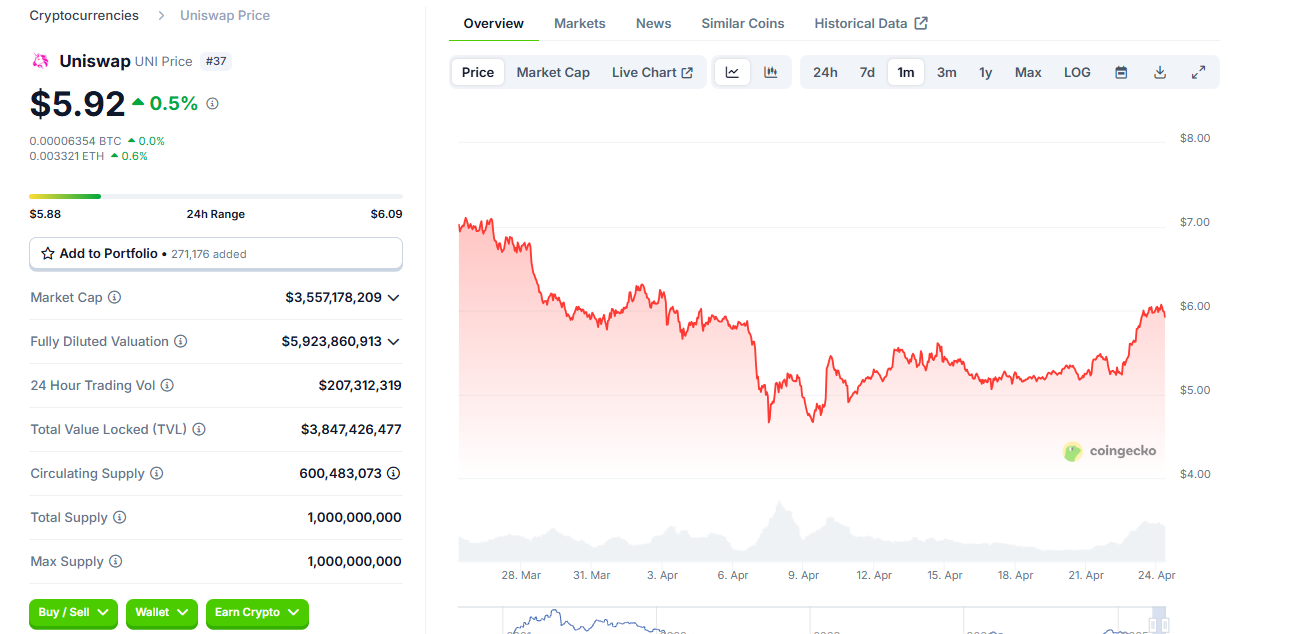
Uniswap chart. Source: CoinGecko
If this move signals an intent to liquidate or stake UNI, as Coinbase Prime often facilitates large-scale trading or custody for institutions, it could trigger volatility in UNI and generally lead to a short-term correction in the Uniswap price. Therefore, traders should exercise caution regarding this move.
Uniswap's technical outlook shows resistance around its 50-day EMA
Uniswap price retested and found support around its August 5 low of $4.70 on April 9, and it has recovered nearly 27% in the last two weeks. However, at the time of writing on Tuesday, it faces resistance around its 50-day Exponential Moving Average at around $6.28 and is declining slightly.
If the 50-day EMA continues to hold as resistance, UNI could extend the decline to retest its next support level at $5.52. A successful close below this could extend an additional decline to test its August 5 low of $4.70.
The Relative Strength Index (RSI) on the daily chart reads 53, just above its neutral level of 50, and points downwards, indicating a fading of bullish momentum. However, if the RSI slips below its neutral level, it suggests a rise in bearish momentum and a sharp decline in Uniswap price.
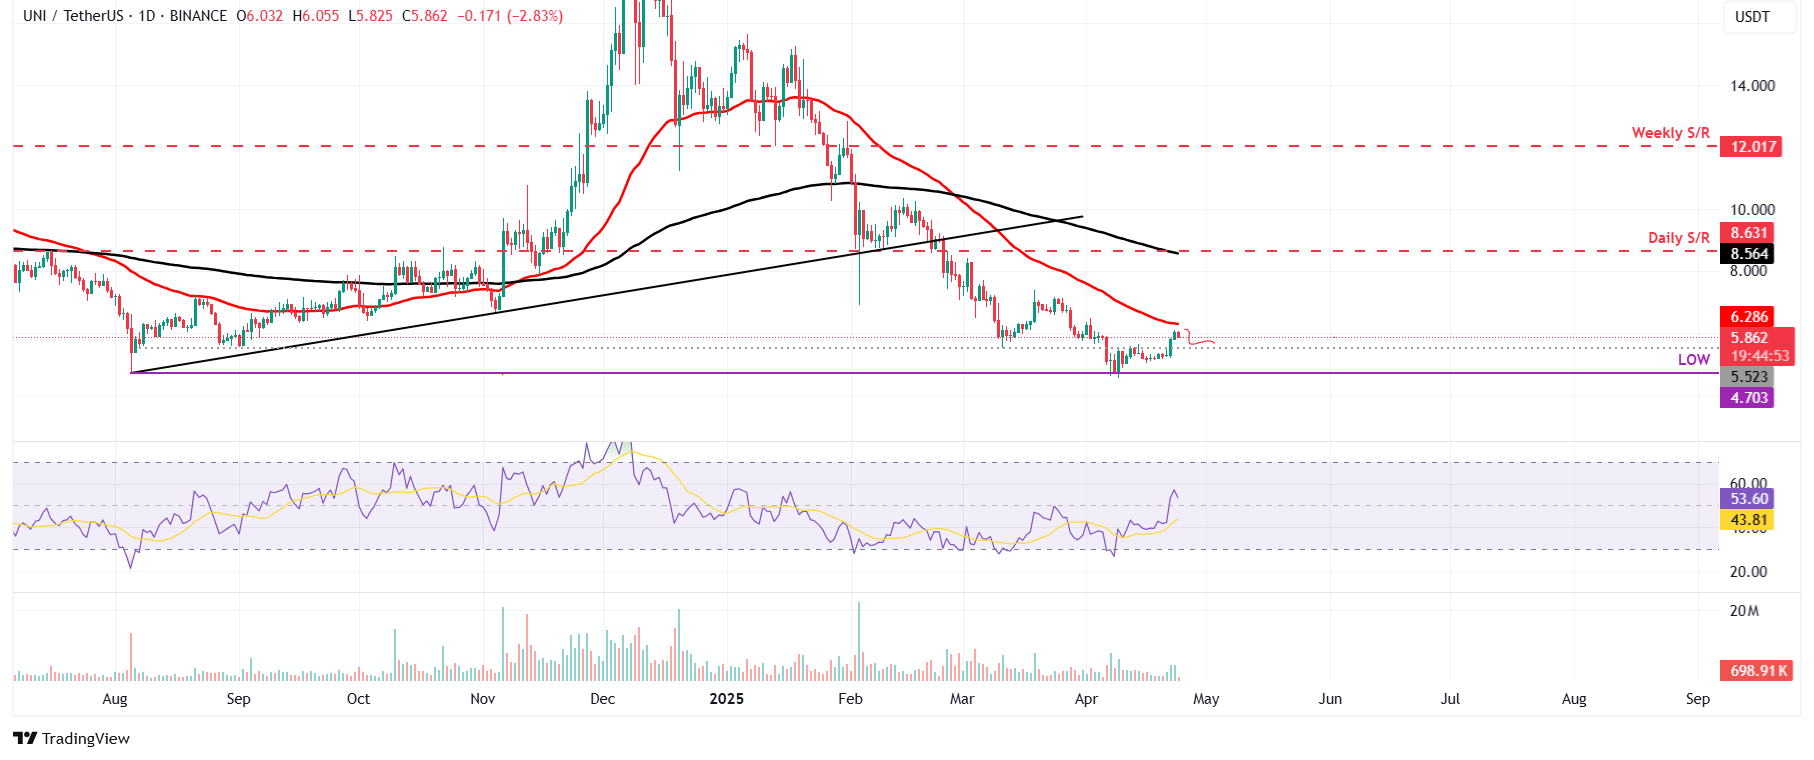
UNI/USDT daily chart
Conversely, if UNI breaks and closes above its 50-day EMA at $6.28, it could extend the rally to retest its psychologically important level of $7.
* The content presented above, whether from a third party or not, is considered as general advice only. This article should not be construed as containing investment advice, investment recommendations, an offer of or solicitation for any transactions in financial instruments.


