
Top 3 Price Prediction Bitcoin, Ethereum, Ripple: Bulls target $95,000 BTC, $1,900 ETH, and $3 XRP


Bitcoin price hovers around $92,800 on Wednesday, having rallied 9.75% over the past two days.
Ethereum price closes above the psychologically significant level of $1,700, indicating an uptrend ahead.
XRP approaches the $2.23 resistance; a breakout could signal a potential rally.
Bitcoin (BTC) price hovers around $92,800 on Wednesday after rallying 9.75% over the past two days. Ethereum (ETH) and Ripple (XRP) followed BTC’s footsteps and continued their recovery rally. The technical outlook suggests an upward trend, targeting $95,000 BTC, $1,900 ETH, and $3 XRP.
Bitcoin bulls are aiming for the $95,000 mark
Bitcoin price has faced multiple rejections around its 200-day Exponential Moving Average (EMA) at $85,000 since April 13. On Monday, BTC finally broke above this resistance level, rising 9.7% to close above $90,000. At the time of writing on Wednesday, it hovers at around the $92,800 level.
If BTC continues its upward momentum, it could extend the rally to test its March 2 high of $95,000.
The daily chart's Relative Strength Index (RSI) stands at 65, above its neutral level of 50, indicating bullish momentum.

BTC/USDT daily chart
On the contrary, if BTC declines, it could find support around its key level of $85,000.
Ethereum could rally further as it closes above its $1,700 resistance level
Ethereum price rallied 11.19% on Tuesday, breaking above the $1,700 resistance level. At the time of writing on Wednesday, it continues to trade higher at around $1,780.
If ETH continues its upward trend, it could extend the rally to retest its next daily resistance at $1,861.
The RSI on the daily chart stands at 54, above its neutral level of 50, indicating bullish momentum.
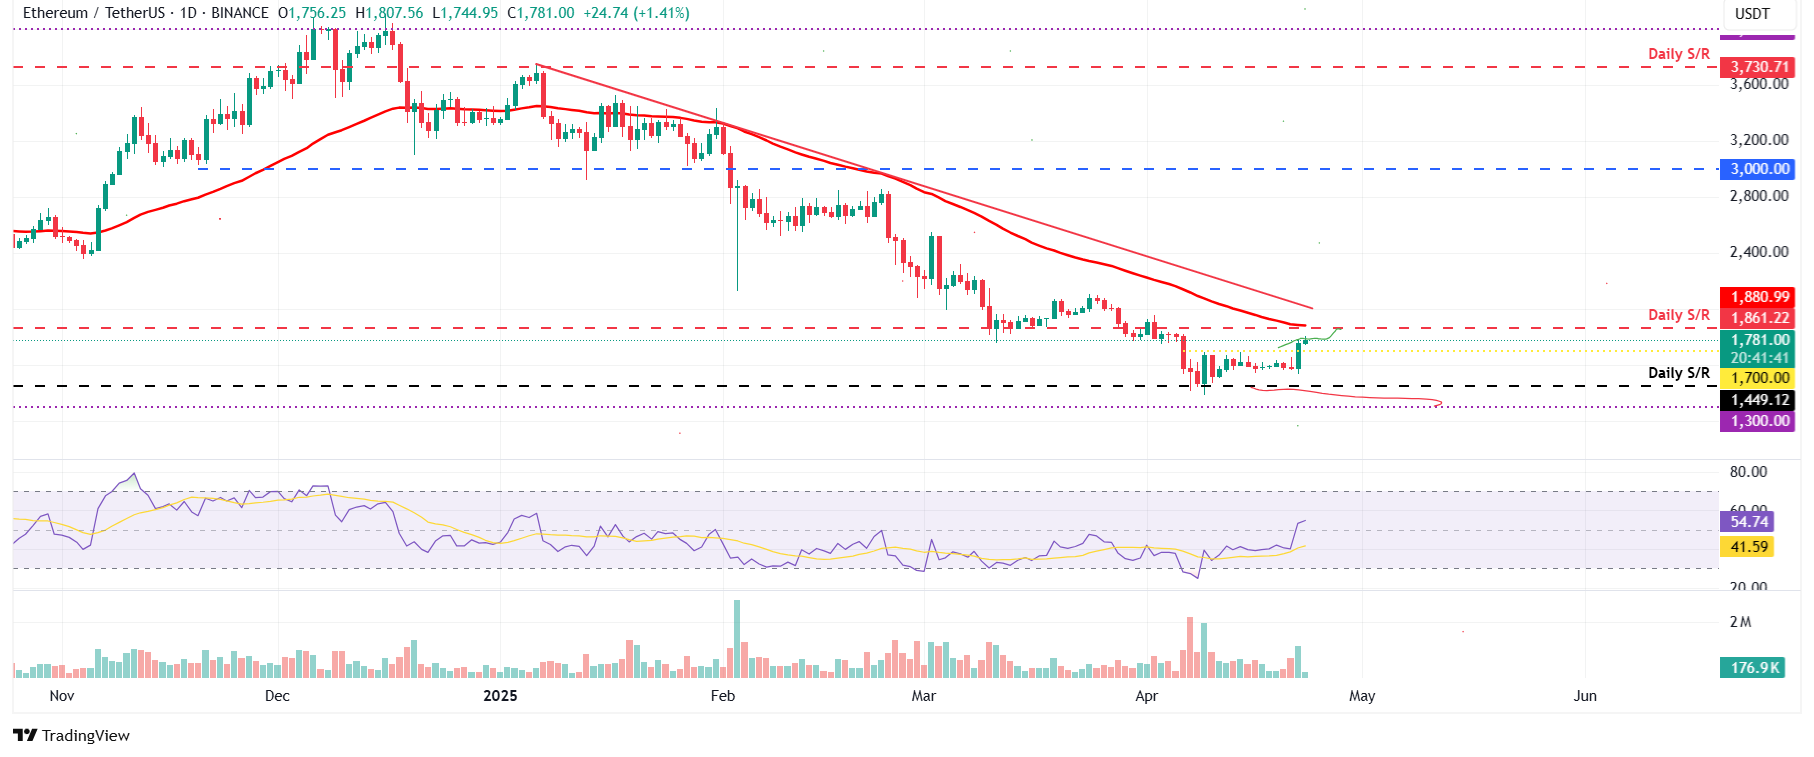
ETH/USDT daily chart
However, if ETH experiences a correction, it could extend its losses and retest its daily support level at $1,449.
XRP could target $3.00 if it closes above its resistance level of $2.23
XRP price rose 6.53% and closed above its 50-day Exponential Moving Average at $2.19 on Tuesday. At the time of writing on Wednesday, it is approaching its daily resistance level at around $2.23.
If XRP closes above its daily resistance level of $2.23, it will extend the rally to retest its March 24 high of $2.50 before potentially reaching $3.00.
The RSI on the daily chart reads 56, above its neutral level of 50, indicating bullish momentum.

XRP/USDT daily chart
However, if XRP continues its decline and closes below its 200-day EMA, it could extend the decline to retest its next support level at $1.77.
* The content presented above, whether from a third party or not, is considered as general advice only. This article should not be construed as containing investment advice, investment recommendations, an offer of or solicitation for any transactions in financial instruments.


